Cleantech Financial Model: Revenue, R&D Costs, and Unit Economics
A cleantech financial model projects revenue, R&D costs, and unit economics for climate technology startups. It differs from pure SaaS models because it must account for hardware development cycles, carbon credit revenue, grant funding, and capex-heavy production scaling.
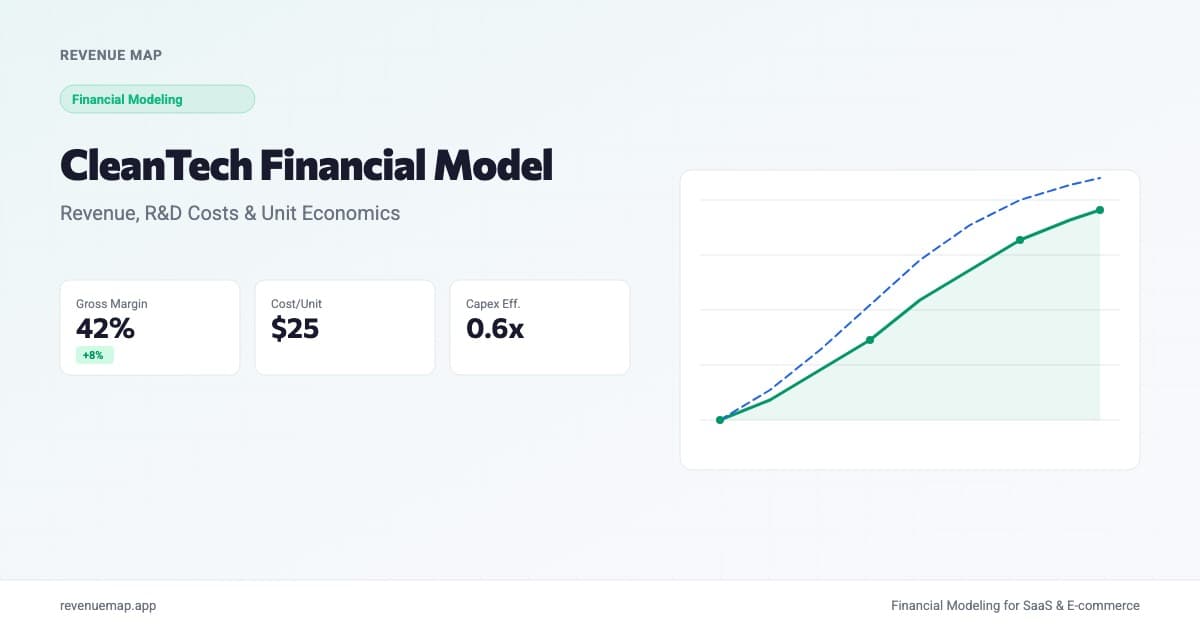
A cleantech financial model is a structured projection of how a climate technology business converts R&D investment into commercial revenue, accounting for hardware development cycles, production scaling costs, and multiple revenue streams including product sales, carbon credits, and grant funding. If you are building a financial model for a cleantech startup, the core challenge is modeling a cost structure that looks nothing like software: heavy upfront capex, long development timelines, and unit economics that only work at production scale.
The sector is attracting serious capital. Syntetica, a French nylon-recycling startup, just closed a $30M Series A with backing from Lululemon, a deal that illustrates how corporate partners and strategic investors are betting on climate technologies with clear unit economics. But raising that capital requires a financial model that speaks the language of hardware scaling, not monthly recurring revenue.
What Makes Cleantech Financial Models Different?
Cleantech financial models differ from SaaS financial models in three fundamental ways: the cost structure is front-loaded rather than marginal, revenue comes from multiple distinct streams, and the timeline from funding to first dollar of product revenue is measured in years rather than months.
Hardware R&D dominance. A SaaS company can ship an MVP in weeks. A cleantech startup developing novel recycling processes, battery chemistry, or carbon capture technology may spend 18-36 months in R&D before generating any product revenue. Your model needs to capture this pre-revenue burn period explicitly, not bury it in a single "development phase" assumption. Track R&D headcount, materials, lab costs, and pilot production separately so investors can see where the money goes.
Blended revenue streams. Most cleantech companies have at least two revenue sources: the core product or service, and some form of environmental credit or certificate. Some have three or four, adding government grants, licensing fees, or consulting revenue from pilot deployments. Each stream has different margins, growth trajectories, and risk profiles. Modeling them as a single line item obscures the economics.
Capex-driven scaling. Scaling a SaaS product means adding servers. Scaling a cleantech product means building or leasing manufacturing facilities, purchasing industrial equipment, and hiring process engineers. Your model needs a capex schedule that maps spending to production capacity milestones, because your runway depends on when that capex hits.
The Four Revenue Streams in Cleantech
Not every cleantech company has all four, but your model should account for the ones that apply.
Product or Service Revenue
This is your core offering: recycled materials sold to manufacturers, clean energy delivered to the grid, water purification services billed per gallon. Model it bottom-up from production capacity, utilization rate, and price per unit. Early-stage models should include a ramp schedule that reflects realistic manufacturing scale-up. Going from lab-scale to pilot to commercial production rarely follows a straight line.
Carbon Credits and Environmental Certificates
Voluntary carbon markets and compliance schemes (like the EU Emissions Trading System) create a secondary revenue stream for companies that verifiably reduce emissions. Revenue depends on three variables: verified tons of CO2 equivalent avoided or removed, the market price per ton, and the verification and registration costs that reduce your net proceeds. Model conservatively. Carbon credit prices have ranged from $5 to $50 per ton in voluntary markets over the past three years, and assuming the high end will hurt your credibility with investors.
Government Grants and Subsidies
Many cleantech startups receive non-dilutive funding through programs like the U.S. DOE, EU Horizon, or national innovation agencies. Grants are lumpy, milestone-gated, and time-limited. Model them as separate line items with clear start and end dates. Never build your base case around grants you have not yet been awarded.
Licensing and Technology Partnerships
If your core innovation is a novel process or material, licensing it to established manufacturers can generate revenue without the capex of building your own production. Syntetica's partnership model with a major brand like Lululemon is a signal: corporate partners will pay for access to proprietary cleantech processes when those processes solve a supply chain problem they cannot fix internally.
How to Model Cleantech Unit Economics
The central question in any cleantech financial model is whether your unit economics work at scale. Here is the thing: nearly every cleantech technology works in a lab. The question is whether it works at a cost that lets you sell the output at a competitive price and still earn a margin.
Step 1: Define Your Unit
Your "unit" depends on your business model. For a materials company, it might be a kilogram of recycled nylon. For an energy company, a megawatt-hour. For a water tech company, a cubic meter of treated water. Pick the unit that maps directly to how you charge customers.
Step 2: Calculate Cost Per Unit at Scale
Work backward from your target production volume. Include raw materials, energy, labor, equipment depreciation, facility costs, and yield losses. The formula:
Cost Per Unit = (Materials + Energy + Labor + Depreciation + Overhead) / Units Produced
Be honest about yield. First-generation production processes often achieve 60-75% yield. Mature processes reach 85-95%. Your model should show yield improvement over time, but do not assume best-case yields in year one.
Step 3: Model the Gross Margin Trajectory
Cleantech gross margins follow a characteristic curve. They start negative or very low during pilot production, improve rapidly as you move through initial scale-up, and then improve more gradually as you optimize the mature process. A realistic trajectory might look like this:
| Stage | Production Scale | Gross Margin | Timeline |
|---|---|---|---|
| Pilot | 1-5% of target | Negative to 10% | Year 1-2 |
| Early Commercial | 10-30% of target | 15-30% | Year 2-3 |
| Growth | 30-70% of target | 30-45% | Year 3-4 |
| Mature | 70-100% of target | 40-55% | Year 4+ |
Software-enabled cleantech (SaaS platforms for energy management, carbon accounting, or supply chain sustainability tracking) can skip most of this curve and target 60-75% gross margins from launch, similar to a vertical SaaS model.
Calculate Your Cleantech Unit Economics
Cleantech Unit Economics Calculator
Calculate your cost per unit and gross margin at production scale
Cleantech vs. SaaS: Key Financial Model Differences
| Dimension | Cleantech | SaaS |
|---|---|---|
| Time to first revenue | 12-36 months | 1-6 months |
| Primary COGS | Raw materials, energy, labor | Hosting, compute |
| Gross margin at scale | 40-55% (hardware), 60-75% (software) | 70-85% |
| Capex requirements | High (equipment, facilities) | Low (cloud infrastructure) |
| Revenue model | Per-unit, contracts, credits | Subscription, usage-based |
| Scaling constraint | Manufacturing capacity | Sales and marketing |
| Grant/subsidy revenue | Common (5-20% of total) | Rare |
The comparison matters because investors will benchmark your model against the asset class they know best. If your investor base is software-focused, your model needs to explicitly address why your margins are lower than SaaS and show the path to profitability despite higher COGS.
Modeling the Capex Schedule
Cleantech capex is the budget item that catches first-time founders off guard. Equipment purchases, facility buildouts, and production line installations are large, lumpy expenses that directly determine your burn rate and runway.
Build your capex schedule around production capacity milestones. For each milestone, specify the equipment needed, the lead time for procurement and installation, the cost, and the production capacity it unlocks. Then map these milestones to your revenue ramp. The goal is to show investors that each round of capex spending is justified by the revenue it enables.
A common mistake is modeling capex as a percentage of revenue. That gets the causality backward. In cleantech, capex comes first and revenue follows. Model it as a discrete schedule tied to production phases.
Capex Efficiency = Annual Revenue / Cumulative Capex Deployed
Investors want to see this ratio improving over time. A ratio below 0.3x in year three signals that the business is too capital-intensive for the revenue it generates. Above 0.5x is a reasonable target for hardware-heavy cleantech.
Common Mistakes to Avoid
-
Ignoring the J-curve on margins. Cleantech margins start low and improve with scale. Models that show 50% gross margin in year one are not credible. Show the real trajectory with clear assumptions about yield improvement, procurement scale advantages, and process optimization.
-
Treating carbon credits as guaranteed revenue. Carbon credit markets are volatile, and verification takes time. Model them as upside in your optimistic scenario, not a pillar of your base case. If credit revenue disappears tomorrow, your core business should still have a path to profitability.
-
Underestimating working capital needs. Hardware businesses tie up cash in raw materials inventory, work-in-progress, and accounts receivable from enterprise customers with 60-90 day payment terms. Your cash flow model must account for working capital cycles that SaaS companies never face.
-
Modeling a single scenario. Cleantech has more variables than software. Run at least three scenarios varying production yield, input costs, carbon credit prices, and customer adoption rates. Investors want to see that you have thought through what happens when things do not go as planned.
Key Takeaways
- Cleantech financial models must separate at least two revenue streams (product revenue and environmental credits) and model each with its own margin profile and growth trajectory.
- Unit economics at production scale are the centerpiece of the model. Show the full cost stack per unit and the margin improvement curve from pilot to mature production.
- Capex schedules should be milestone-based, not percentage-based. Each investment should map to a specific production capacity unlock.
- Gross margin targets differ by subtype: 40-55% for hardware-heavy cleantech, 60-75% for software-enabled climate tech.
- Conservative carbon credit assumptions and explicit working capital modeling are what separate credible cleantech models from wishful thinking.
Building a cleantech financial model forces you to confront the real economics of your technology before you run out of runway. Start building your model with Revenue Map to stress-test your unit economics across scenarios before your next fundraise.
Related Articles
Break-Even Analysis: How to Calculate for Startups
Learn how to calculate your break-even point with formulas, examples, and benchmarks. Includes a free calculator and tips for SaaS and e-commerce founders.
Robotics Startup Financial Model: Costs, Margins, R&D
Build a financial model for a robotics startup. Covers BOM costs, R&D burn, manufacturing margins, and the unit economics investors need to see.
Construction Tech Financial Model for Startups
Build a construction tech financial model with project revenue, bid win rates, and contractor unit economics. Includes benchmarks and a revenue calculator.