SaaS Financial Modeling: The Complete Guide for Founders and CFOs
A SaaS financial model is a dynamic multi-scenario framework that projects revenue, costs, and cash flow for a subscription business. It has four layers: a revenue model, a cost model, a cash model, and a scenario model. Build it bottom-up from unit economics and update it monthly against actual results.
By Tim Kozin

A SaaS financial model is a structured, dynamic representation of how your subscription business generates revenue, incurs costs, and consumes or produces cash, built to support decisions, not just report history. Every serious SaaS financial model contains four layers: a revenue model, a cost model, a cash model, and a scenario model. Most founder-built models contain one. That's why they stop being used within 90 days of being created.
What Is a SaaS Financial Model?
A SaaS financial model is defined as a dynamic, multi-scenario framework that projects revenue, costs, and cash flow for a subscription business, integrated with unit economics and updated monthly against actual results.
It is not a spreadsheet forecast. A forecast tells you what you expect to happen under one set of assumptions. A model lets you stress-test those assumptions, branch into multiple scenarios, and compare what you projected against what actually occurred. The distinction matters because SaaS businesses are assumption-dense: churn rate, ARPA, expansion revenue, gross margin, sales cycle length, and CAC all interact with each other in ways that a single-line revenue projection cannot capture.
Three things a real SaaS financial model does that a basic forecast doesn't.
Scenario branching. A model produces conservative, base, and aggressive projections simultaneously, so you can make hiring, spending, and fundraising decisions against a range of outcomes rather than a single number that will certainly be wrong.
Plan vs. actual tracking. A model is updated monthly with real numbers. The gap between projected and actual, the variance, is where the business intelligence lives. A model you stop updating after month 2 is not a model. It's a historical artifact.
Unit economics integration. Revenue projections that aren't grounded in LTV, CAC, and gross margin are disconnected from the mechanics of the business. A real SaaS model ties revenue growth to the cost of acquiring and retaining customers, so growth assumptions have a cost attached.
Why Most SaaS Financial Models Fail
Most SaaS financial models fail not because they're built wrong, but because they're built for the wrong purpose, created for a fundraising pitch rather than as a tool for running the business.
There are four specific failure modes worth naming.
1. Single-point forecasts with no scenario branches. A model that produces one revenue projection is a guess with formatting. It creates false precision, founders treat the number as a commitment rather than a range, and it provides no decision framework when reality deviates from the plan, which it always does. The question isn't whether your base case will be wrong. It's whether you've modeled what happens when it is.
2. Models disconnected from actuals after month 2. This is the most common failure mode in early-stage SaaS. The model gets built in the week before a fundraising conversation, the round closes, and the spreadsheet never gets opened again. Six months later, it bears no relationship to the actual business. A financial model that isn't updated monthly provides no value, and actively misleads if referenced in board meetings or investor updates.
3. Missing unit economics layer. Revenue projections without LTV, CAC, and gross margin assumptions are architecturally incomplete. If your model shows $500K ARR in month 18 but doesn't show what it costs to acquire those customers or what margin they generate, you don't know whether that $500K is worth having. The unit economics layer is what connects top-line growth to bottom-line sustainability.
4. Over-engineered complexity. A 47-tab Excel model with circular references and macros that break when you change the font is not a more sophisticated model, it's an unusable one. The best SaaS financial models are the ones founders actually open every month. Simplicity and consistent use beat complexity and abandonment every time.
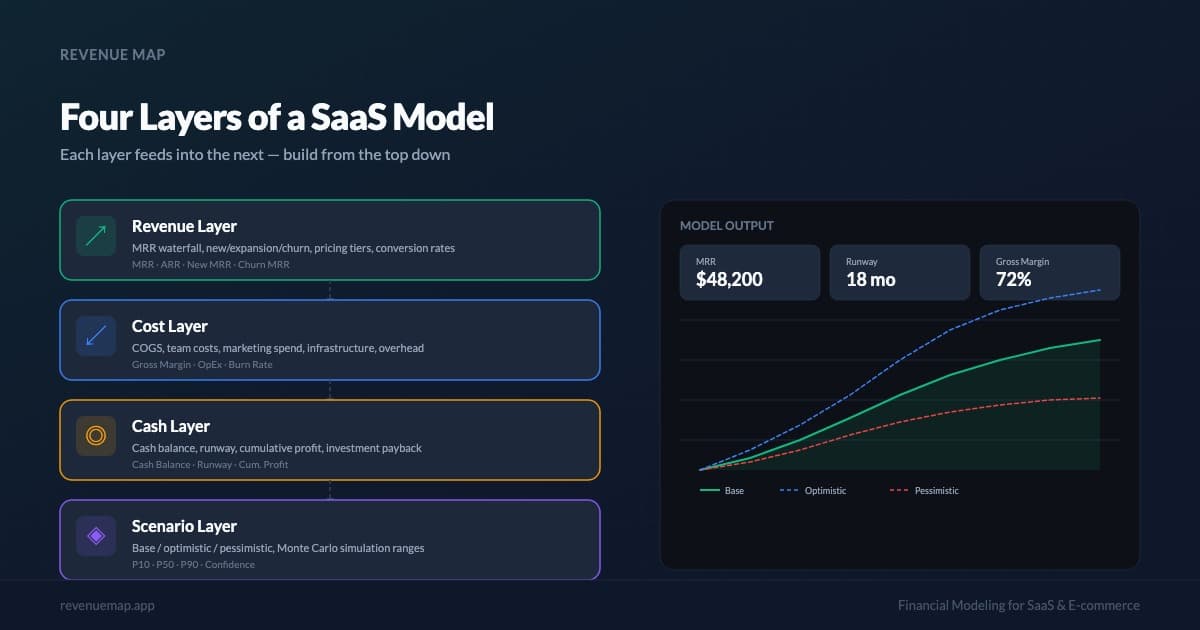
The Four Layers of a SaaS Financial Model
A complete SaaS financial model is built from four stacked layers, each dependent on the one below it, and each answering a different question about your business.
Layer 1: Revenue Model
The revenue model is the foundation. It projects MRR forward using the five-component waterfall: New MRR, Expansion MRR, Reactivation MRR, Contraction MRR, and Churned MRR. The output is Net New MRR each month and a cumulative MRR/ARR trajectory. For a full breakdown of each of these five MRR components with worked examples, see our guide on how to calculate and track MRR.
Key inputs: starting MRR, monthly new customer acquisition, ARPA, churn rate, and expansion rate. Every assumption in the revenue model should be independently testable against your actuals, if your model assumes 2% monthly churn and your actual churn is 4%, that variance is an immediate signal, not a footnote.
Layer 2: Cost Model
The cost model sits on top of the revenue model and converts gross revenue into gross profit, then into operating loss or income. It contains three sub-components: COGS (hosting, support, payment processing, costs that scale directly with revenue), gross margin (revenue minus COGS, expressed as a percentage), and operating expenses (engineering, sales, marketing, and G&A, typically modeled as fixed monthly costs with growth assumptions).
SaaS gross margin benchmarks: 65–70% is the floor for a fundable SaaS business; 75–85% is typical for well-run software-only SaaS; below 60% signals a services-heavy or infrastructure-heavy cost structure that will compress valuation multiples.
Layer 3: Cash Model
The cash model converts operating loss into a cash burn and runway calculation. It adds non-operating cash flows (fundraising, debt) and accounts for timing differences between revenue recognition and cash collection, particularly relevant for annual contracts.
Key outputs: monthly net burn, cumulative cash consumed, and runway in months. Runway = cash balance / monthly net burn. A business with $400,000 in the bank burning $32,000 per month has 12.5 months of runway, not "over a year," not "comfortable." 12.5 months. Precision matters because fundraising takes 4–6 months and you need 3–6 months of buffer beyond that.
Layer 4: Scenario Model
The scenario layer applies different assumption sets to Layers 1–3 simultaneously, producing a conservative, base, and aggressive version of the entire model. It's not a separate tab with different numbers. It's a parameter switch that flows through every calculation below it.
The scenario layer is what transforms a static projection into a decision-support tool. It lets you answer: what happens to runway if growth comes in 30% below plan? What does churn need to be for us to hit $1M ARR by month 18? At what growth rate does our current cash cover us to the next fundraise?
How to Build Your SaaS Revenue Model (Step-by-Step)
Build your SaaS revenue model bottom-up from unit economics inputs, not top-down from a percentage of TAM.
Top-down models ("we'll capture 1% of a $10B market") are not financial models. They're market sizing exercises that tell you nothing about whether your acquisition and retention mechanics can actually produce the projected revenue. Bottom-up models start with what you know: current MRR, monthly customer acquisition rate, ARPA, and churn rate. Everything else is derived.
Step 1, Establish your starting MRR. Use your actual, normalized MRR as defined in the revenue model, active subscribers × ARPA, with annual contracts normalized to monthly. This is your baseline. Do not adjust it upward.
Step 2, Set your monthly new customer acquisition assumption. How many new customers are you adding per month, and at what ARPA? In the base case, use your current trailing 3-month average. In the aggressive case, apply your target growth rate. In the conservative case, assume flat or declining acquisition.
Step 3, Set your churn rate assumption. Use your actual trailing 3-month average churn rate for the base case. Conservative case: add 1–2 percentage points. Aggressive case: model the churn rate you'd achieve with the onboarding improvements you've planned but not yet shipped.
Step 4, Apply the Net New MRR formula each month.
Net New MRR = New MRR + Expansion MRR - Contraction MRR - Churned MRR
MRR (Month N) = MRR (Month N-1) + Net New MRR (Month N)
Step 5, Project forward 12–24 months. 12 months for operational planning. 18–24 months for fundraising conversations. Beyond 24 months, SaaS assumptions compound error fast enough that precision becomes meaningless.
Worked example, Acme SaaS: Starting MRR: $15,000. New customers per month: 20 at $150 ARPA ($3,000 New MRR). Expansion rate: 0.5% of prior MRR. Monthly churn rate: 2%.
Month 1:
Churned MRR = $15,000 × 0.02 = $300
Expansion MRR = $15,000 × 0.005 = $75
Net New MRR = $3,000 + $75 - $300 = $2,775
MRR (Month 1) = $15,000 + $2,775 = $17,775
Projected MRR at month 12 (base case): approximately $51,200, a 3.4× increase driven by consistent acquisition and controlled churn. Cut new customer acquisition by 30% (conservative case) and month 12 MRR drops to approximately $38,900. Raise expansion rate to 1% of MRR (aggressive case) and month 12 MRR reaches approximately $58,400. That $19,500 range, the spread between conservative and aggressive, is the decision space your scenario model is designed to illuminate.
SaaS Revenue Forecast Calculator
Enter your current MRR, growth rate, churn rate, and forecast period to project where your MRR will be at the end of the period.
The Key Metrics Your SaaS Model Must Output
Investors reviewing a SaaS financial model are not reading every cell. They're looking for five specific outputs that tell them whether the business has durable, scalable economics. Your model should surface these on a summary page, not buried in supporting tabs.
MRR and ARR with Growth Rate
Monthly recurring revenue and its annualized equivalent, with month-over-month and year-over-year growth rates. MRR is the operational heartbeat; ARR is the investor-facing headline. Both should be visible with their trajectory, not just their current value. For the step-by-step calculation method and the five MRR components that drive it, see Monthly Recurring Revenue: How to Calculate and Track It.
Gross Margin
Gross margin is the single most important valuation driver in SaaS. Businesses above 75% gross margin command revenue multiples of 8–15×. Businesses below 60% look operationally more like services businesses and get priced accordingly. Your model must show gross margin by month, not just as a static assumption, because it often deteriorates as you scale support costs ahead of automation.
CAC Payback Period
How many months of gross profit does it take to recover the cost of acquiring a customer? Target under 12 months for most SaaS businesses; under 18 months is acceptable at early stage; above 24 months creates a capital efficiency problem that becomes critical as you scale. CAC payback connects your revenue model to your cost model, it's the metric that tells you whether growth is affordable.
Net Revenue Retention (NRR)
NRR measures the revenue retained from existing customers after accounting for churn, contraction, and expansion. An NRR above 100% means your existing customer base is growing without any new acquisition. This is the metric that most predicts the long-term trajectory of a SaaS business, and the one most investors will interrogate most carefully.
NRR = (MRR at Start + Expansion MRR - Contraction MRR - Churned MRR) / MRR at Start × 100
Best-in-class SaaS: NRR above 120%. Healthy: 100–120%. Below 100%: existing customers are shrinking the base, new acquisition is just replacing what's leaking.
Burn Rate and Runway
Net monthly cash burn and the number of months of runway remaining at current burn. These are survival metrics. Model them separately from operating loss, cash timing differences matter, especially when annual contracts create lumpy inflows. Always know your runway to within 30 days of precision.
Scenario Planning: Conservative, Base, and Aggressive
Scenario planning is defined as the practice of building multiple simultaneous projections under different assumption sets, so decisions can be made against a range of outcomes rather than a single point estimate.
Single-point forecasts create a specific failure mode: when reality misses the projection, and it will, you have no pre-built framework for what to do next. Scenario planning solves this by forcing you to define, in advance, what "bad" and "good" look like and what the appropriate response is to each.
A practical three-scenario framework:
| Assumption | Conservative | Base | Aggressive |
|---|---|---|---|
| Monthly new MRR | Trailing 3-month avg × 0.7 | Trailing 3-month avg | Trailing 3-month avg × 1.3 |
| Monthly churn rate | Current + 1.5% | Current | Current − 0.5% |
| Gross margin | Current − 3% | Current | Current + 2% |
| New hire timing | Delay 60 days | As planned | Accelerate 30 days |
The decision rule by scenario: use the base case for headcount planning and operating budget. Use the conservative case for cash management and fundraising timing, if conservative runway falls below 9 months, start the fundraising process immediately. Use the aggressive case only for investor conversations, and only with explicit labeling. An aggressive case presented as a base case destroys credibility in due diligence.
Plan vs. Actual: How to Use Your Model Every Month
The plan vs. actual comparison is the most valuable and most neglected practice in SaaS financial management, it turns a static model into a real-time diagnostic tool.
Most founders build a financial model for a fundraising round and never open it again until the next one. That's the equivalent of building a GPS route and then ignoring it the moment you leave the driveway. The model is only useful if you're comparing where you are to where you planned to be, and adjusting forward assumptions based on what you learn.
A monthly plan vs. actual cadence requires three questions.
1. Are we ahead or behind on MRR? Calculate the variance between projected and actual MRR. If you're behind, decompose by MRR type, is the miss in new customer acquisition, higher-than-modeled churn, or lower expansion? The source of the variance determines the response. Missing new MRR is a sales or marketing problem. Excess churn is a product or onboarding problem. They require different interventions.
2. Is churn tracking better or worse than modeled? Churn variance compounds. If your actual monthly churn is running 0.5% above your modeled rate, recalculate your 12-month MRR projection with the updated assumption. The gap between the original projection and the revised one is the cost of that churn gap, expressed in dollars, not percentage points. That number usually gets attention in a way that "churn is slightly elevated" does not.
3. Is burn tracking to plan? Compare actual monthly cash consumption to modeled burn. Variance in burn usually comes from two sources: payroll timing (new hires joining earlier or later than planned) and marketing spend (paid acquisition scaling faster than modeled). Identify which category the variance falls into before drawing conclusions about burn trend.
Update your forward assumptions every month based on what the actuals reveal. A model updated monthly with real data is compounding institutional knowledge about how your business actually operates, which is the highest-value output a financial model can produce.
Common SaaS Financial Modeling Mistakes
1. Modeling revenue without modeling churn. A revenue model that shows new customer additions without explicitly modeling monthly churn is an acquisition funnel, not a financial model. Churn silently erodes the base in every period, a model that doesn't account for it will systematically overstate MRR and ARR projections, sometimes by 30–50% over a 12-month horizon at typical early-stage churn rates.
2. Using top-down TAM sizing instead of bottom-up unit economics. "We'll capture 0.5% of a $20B market within 3 years" is not a financial model input. It's a market sizing assertion with no connection to how customers are actually acquired and retained. Build from the bottom up: current customers, average ARPA, acquisition cost, churn rate, expansion rate. Let the revenue number emerge from the unit economics rather than reverse-engineering the unit economics to justify a revenue target.
3. Building in Excel with no version control or update discipline. Excel financial models degrade rapidly in SaaS environments, copy-paste errors, broken formula references, and the absence of version control mean that a model touched by more than one person over more than two months is likely to contain errors that invalidate key outputs. At minimum, maintain dated snapshots. Better: move to a purpose-built financial modeling tool that integrates with your actuals automatically.
4. Treating the model as a fundraising document rather than a management tool. The model built for a pitch deck is optimized for persuasion, not accuracy. It front-loads hockey-stick assumptions, buries risk cases, and is never designed to survive contact with reality. Build your model to be right, not to be impressive, and use the aggressive scenario for investor conversations rather than inflating the base case.
Key Takeaways
- A SaaS financial model has four layers: revenue, cost, cash, and scenario, a model missing any layer is structurally incomplete and will mislead the decisions it's supposed to support
- Build revenue models bottom-up from unit economics, not top-down from TAM, current MRR, acquisition rate, ARPA, churn rate, and expansion rate are the only inputs you need
- NRR above 100% means your existing customer base is self-growing, it's the single metric most predictive of long-term SaaS trajectory and the first number sophisticated investors will interrogate
- Use conservative case for cash management, base case for operations, aggressive case for investor conversations, presenting aggressive assumptions as base case destroys due diligence credibility
- A model updated monthly with plan vs. actual data compounds institutional knowledge, the variance between projected and actual MRR, decomposed by type, is more valuable than the model itself
- Runway = cash balance / monthly net burn, always know this number to within 30 days; if conservative-case runway falls below 9 months, start fundraising immediately
A financial model isn't a document you build once and file away. It's the operating system of your business, and it's only as good as the inputs you feed it and the discipline with which you update it. Start with clean monthly recurring revenue tracking and pair it with rigorous churn rate monitoring, those two numbers are the foundation every reliable SaaS financial model is built on. Revenue Map's SaaS financial model is designed around this exact workflow: build your model once, return each month to update actuals, and let the scenario analysis tell you where your business is heading before the board meeting asks. Track the metrics that drive it, ARR, net revenue retention, the Rule of 40, and CAC payback.
Sources
The benchmarks referenced in this guide, SaaS growth rates, net revenue retention ranges, the Rule of 40, and CAC payback norms, reflect figures published in the following industry sources. Where a specific number is cited, treat it as a representative industry range rather than a fixed constant; benchmarks shift by stage, segment, and reporting year.
- OpenView SaaS Benchmarks Report, annual survey of private SaaS growth, retention, and efficiency metrics
- KeyBanc Capital Markets SaaS Survey, widely cited private-company SaaS operating benchmarks
- ChartMogul SaaS Growth & Retention Benchmarks, retention and MRR-movement benchmarks from anonymized subscription data
- Bessemer Venture Partners, State of the Cloud, cloud/SaaS efficiency framing, including the Rule of 40
Related Articles
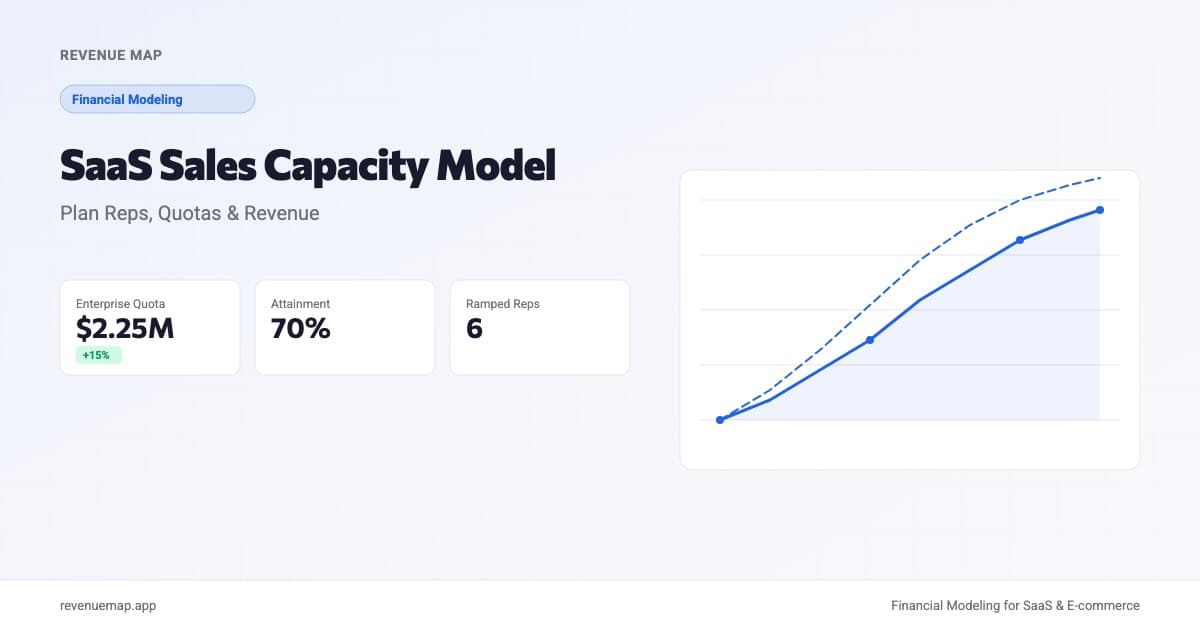
SaaS Sales Capacity Model: Plan Reps, Quotas, Revenue
Build a SaaS sales capacity model to forecast revenue from quota-carrying reps. Includes 2026 benchmarks, formulas, and an interactive calculator.
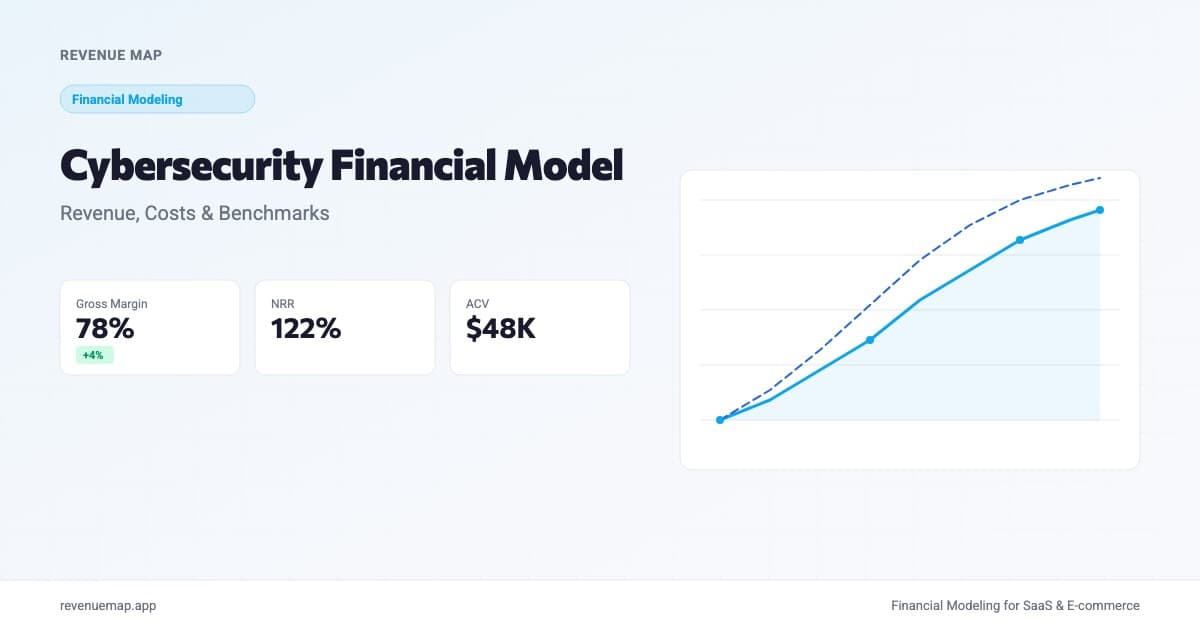
Cybersecurity Financial Model: Revenue, Costs, Benchmarks
Build a cybersecurity startup financial model with benchmarks for ARR, margins, and unit economics. Covers seat-based and platform revenue.

Vertical SaaS Financial Model: Blended Revenue Guide
Build a vertical SaaS financial model that accounts for subscription + transaction revenue, industry-specific costs, and the benchmarks investors expect.