Financial Forecasting for Startups: A Practical Guide
Financial forecasting for startups is the ongoing practice of predicting future revenue, costs, and cash flow using a combination of historical data, market signals, and unit economics. Unlike one-time projections, forecasting is a continuous process that gets updated monthly as actual results come in.
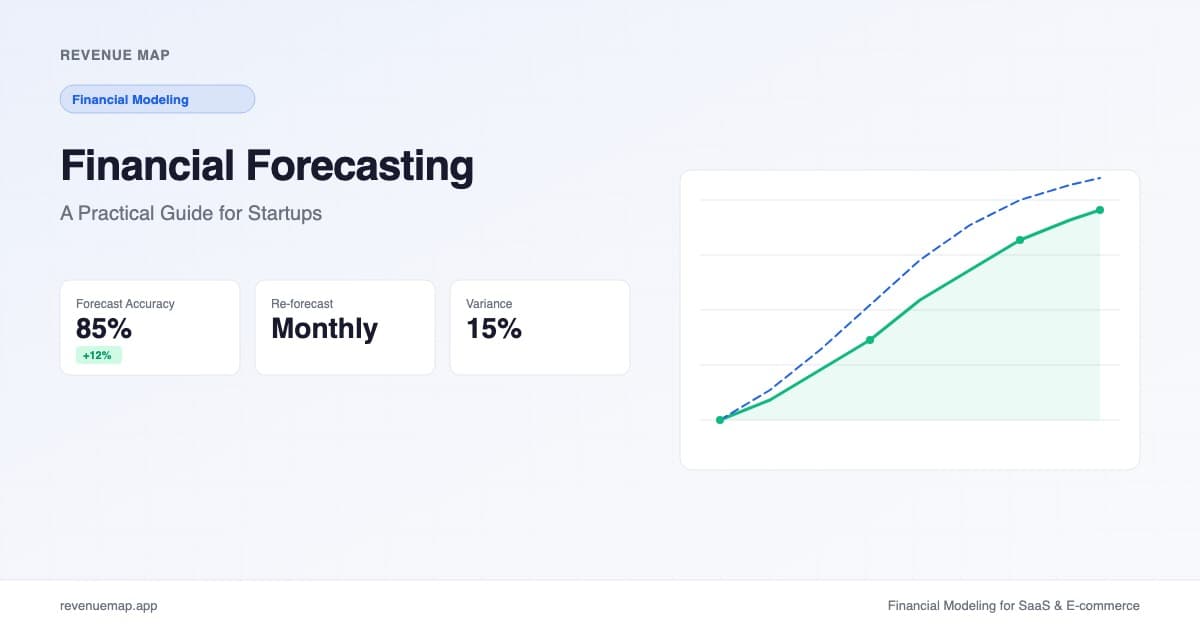
Financial forecasting for startups is the ongoing practice of predicting your revenue, expenses, and cash position, then updating those predictions as real data comes in. It is different from building financial projections once for a pitch deck. Forecasting is a loop: predict, measure, learn, adjust. Done well, it becomes the operating system that connects your strategy to your bank account.
This matters more now than it used to. In a recent TechCrunch episode, Puzzle CEO Sasha Orloff, who has helped founders raise over $1B, put it bluntly: investors lose confidence when they encounter messy financial data or misunderstood metrics. Waiting until you are nearly out of cash to start fundraising costs you leverage, valuation, and sometimes the deal entirely. The founders who maintain a living forecast, rather than dusting off a spreadsheet the week before a board meeting, are the ones who keep their options open.
What Is Financial Forecasting for Startups?
Financial forecasting is the continuous process of estimating future financial outcomes based on historical performance, current trends, and explicit business assumptions. It produces a rolling view of where your revenue, costs, and cash are headed over the next 6 to 18 months.
The "continuous" part is what separates forecasting from projections. Your startup financial projections are a snapshot: you build them once, present them to investors, and they sit mostly untouched. A forecast, on the other hand, is a living document. Every month you compare actuals to the forecast, figure out why they diverged, update your assumptions, and roll the window forward.
Here is the thing: most early-stage founders never make this transition. They build projections for their seed deck, close the round, and then operate without any systematic way to predict whether they will hit their numbers. That gap is where expensive surprises live.
How Is Financial Forecasting Different from Financial Projections?
Both involve predicting the future, but they serve different purposes and follow different rhythms.
| Dimension | Financial Projections | Financial Forecasting |
|---|---|---|
| Purpose | Communicate a plan to investors | Guide operational decisions |
| Update cadence | Once or twice per year | Monthly |
| Time horizon | 18 to 36 months | 3 to 12 months rolling |
| Accuracy expectation | Directional | Within 15 to 30% by Series A |
| Input data | Assumptions and benchmarks | Actuals plus assumptions |
| Primary audience | External (investors, board) | Internal (founders, finance) |
Neither replaces the other. You need projections for fundraising and long-range planning. You need forecasting for running the business month to month. The strongest founders connect the two: the forecast tells you whether you are tracking toward the projection, and when you are not, why.
Five Forecasting Methods That Work for Early-Stage Companies
1. Bottom-Up Forecasting
Start from the smallest measurable unit, your deal pipeline, leads, or paying users, and build revenue from there. For a SaaS company, that means: leads per month multiplied by conversion rate multiplied by average contract value. This approach is grounded in inputs you can actually observe and control.
Best for: any startup with some operating history and measurable unit economics.
2. Cohort-Based Forecasting
Group customers by the month they signed up, then track how each cohort's revenue evolves over time. This method captures retention and expansion patterns that aggregate models miss. If your January cohort retains at 92% per month but your April cohort retains at 85%, your aggregate churn rate is hiding a problem.
Best for: subscription and SaaS businesses with at least 3 to 6 months of cohort data.
3. Driver-Based Forecasting
Identify the 3 to 5 key business drivers (website traffic, sales calls booked, trial-to-paid conversion rate) and model revenue as a function of those drivers. When a driver changes, the forecast updates automatically.
Best for: companies with clearly defined acquisition funnels and consistent conversion metrics.
4. Analogous Forecasting
Use performance data from comparable companies at the same stage. If similar vertical SaaS companies grew MRR at 10 to 15% month-over-month in the first year, that range becomes your baseline. SaaStr recently profiled Owner.com, a vertical B2B platform that accelerated past $100M ARR by building AI agents that automated customer workflows. A company in the same vertical could use Owner's early growth trajectory as a benchmark for its own forecast, while adjusting for differences in go-to-market strategy and market size.
Best for: pre-revenue or very early-stage startups that lack their own historical data.
5. Hybrid Approach
Combine two or more methods. Use bottom-up for the next 3 months (where your pipeline visibility is strong), driver-based for months 4 through 8, and analogous benchmarks for anything beyond that. This matches your forecast resolution to your actual visibility.
Best for: Series A and later companies that need both near-term accuracy and long-range planning.
How to Build a Startup Financial Forecast Step by Step
Step 1: Establish Your Baseline
Pull the last 3 to 6 months of actual financial data: revenue, cost of goods sold, operating expenses, and cash balance. If you are pre-revenue, start with your burn rate and the assumptions behind your launch timeline.
Step 2: Identify Key Assumptions
List every assumption that drives your numbers. Common ones include monthly customer acquisition rate, average revenue per account, gross churn rate, expansion rate, headcount growth, and CAC by channel. Write them down explicitly. A forecast is only as good as its assumptions, and you cannot improve assumptions you never documented.
Step 3: Build the Revenue Forecast
Use the bottom-up method for the near term. Start with current MRR, then add expected new MRR from your pipeline, subtract churned MRR, and add expansion MRR.
Forecast MRR (Month N) = Current MRR
                        + New MRR (leads × conversion × ARPA)
                        - Churned MRR (current MRR × monthly churn rate)
                        + Expansion MRR (current MRR × expansion rate)
For a revenue forecast template that automates this calculation, you can start with Revenue Map's built-in SaaS revenue model.
Step 4: Forecast Expenses
Group costs into fixed (rent, salaries, subscriptions) and variable (hosting, commissions, payment processing). Fixed costs are easier to forecast: they change when you make a hiring or spending decision. Variable costs should scale as a percentage of revenue or customer count.
Step 5: Calculate Cash Position
Ending Cash = Beginning Cash - Net Burn Rate
Net Burn Rate = Total Expenses - Total Revenue
Track this monthly. The moment your forecast shows cash running out before your next planned fundraise, you need to act: cut expenses, accelerate revenue, or start raising sooner.
Calculate Your Revenue Forecast
Revenue Forecast Calculator
Estimate next month's MRR based on current performance
Want to model this over 36 months with scenarios? Try Revenue Map free →
How Often Should You Re-Forecast?
Monthly is the right cadence for most startups. Each month, follow this cycle:
- Close the books. Record actual revenue, expenses, and cash for the prior month.
- Run variance analysis. Compare actuals to your forecast. Where did reality diverge from prediction, and by how much?
- Update assumptions. If your conversion rate dropped from 8% to 5%, that assumption needs to change in the model. If a new hire pushed your payroll higher, adjust.
- Roll the forecast forward. Extend the window by one month so you always have 6 to 12 months of forward visibility.
The honest answer is that most of the value comes from step 2: variance analysis. The forecast itself is a tool for generating useful questions. "We predicted $55K in new MRR but only closed $38K. Why?" That question, asked monthly, is worth more than the most sophisticated model.
Forecast Accuracy Benchmarks by Stage
Your forecast will be wrong. The question is how wrong, and whether it gets better over time.
| Company Stage | Typical Forecast Accuracy | Target Accuracy |
|---|---|---|
| Pre-revenue / Seed | 50 to 70% | Within 30 to 50% |
| Post-revenue / Series A | 75 to 85% | Within 15 to 25% |
| Growth / Series B+ | 85 to 95% | Within 5 to 15% |
Measure accuracy as the absolute percentage error between forecast and actual for each line item. Track the trend. If your forecast accuracy is not improving quarter over quarter, you are not learning from the variance, and that is a process problem, not a modeling problem.
Common Forecasting Mistakes to Avoid
-
Forecasting revenue but not expenses. Revenue alone does not tell you whether you will run out of cash. Always forecast both sides of the equation and track your startup runway as a direct output.
-
Using annual averages for monthly forecasts. Seasonal patterns, sales cycles, and hiring plans create real month-to-month variation. A flat monthly estimate masks the cash crunches that happen between contract renewals or after a large hire.
-
Never updating assumptions. If your conversion rate was 12% three months ago and it is 7% now, your forecast should reflect today's reality, not last quarter's optimism. Stale assumptions are worse than no forecast because they create false confidence.
-
Ignoring leading indicators. Revenue is a lagging indicator. By the time MRR misses, the pipeline problem that caused it happened 2 to 3 months ago. Forecast the leading indicators (leads, demos booked, proposals sent) and let revenue follow.
-
Building a forecast you never reference. The purpose of forecasting is to drive decisions. If you build a forecast in January and never look at it again until the next board meeting, you are projecting, not forecasting. The discipline of monthly comparison is where the value lives.
Key Takeaways
- Financial forecasting is a continuous loop (predict, measure, learn, adjust), not a one-time exercise for your pitch deck.
- Bottom-up forecasting, built from measurable unit economics, is the most reliable method for startups.
- Re-forecast monthly. The variance analysis, understanding why actuals diverged from the forecast, is more valuable than the forecast itself.
- Track forecast accuracy by stage. Seed companies within 30 to 50% is normal; Series A should aim for 15 to 25%.
- Forecast both revenue and expenses together. Revenue forecasts without cost and cash tracking give you an incomplete picture.
A living forecast turns your financial model from a fundraising artifact into an operating tool. Start building yours with Revenue Map, it takes less than five minutes to set up your first rolling forecast.
Related Articles
Revenue Forecast Template for Startups (2026)
Build a revenue forecast from scratch. Grab our template with MRR growth formulas, churn adjustments, and expansion revenue built in.
Financial Projections Template: What to Include
Build a financial projections template with revenue forecasts, cost structure, cash flow, and scenario analysis. Includes formulas, benchmarks, and a free calculator.
Startup Financial Projections: How to Build Them
Learn how to build startup financial projections step by step. Covers revenue models, cost structure, cash flow, benchmarks, and a free runway calculator.