Startup Financial Projections: How to Build Them
Startup financial projections are month-by-month forecasts of revenue, costs, and cash flow for a new business. Build them bottom-up from unit economics: multiply customers by average revenue per user, subtract operating costs, and track the cash balance to determine runway.
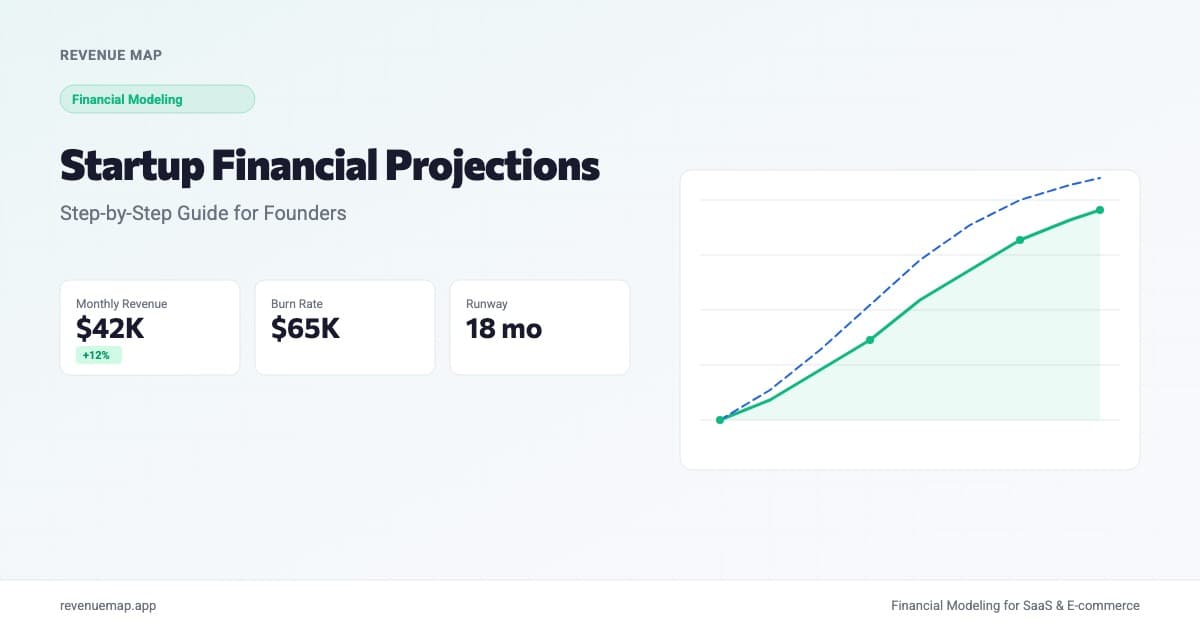
Startup financial projections are month-by-month forecasts of your revenue, costs, and cash position. They translate your business plan into numbers that you and your investors can stress-test. The core method is bottom-up: start with how many customers you expect to acquire, multiply by your average revenue per account, layer in costs, and compute how long your cash will last.
In July 2026, synthetic-user startup Simile raised $200M at a $2B valuation just five months after closing a $100M Series A, according to TechCrunch. Rounds like these move fast, but the financial diligence behind them does not. Investors writing nine-figure checks stress-test projections in detail: monthly cohort assumptions, cost scaling curves, and the exact month when cash runs out under a pessimistic scenario. Whether you are raising $500K or $500M, the mechanics of building defensible projections are the same.
What Are Startup Financial Projections?
Startup financial projections are forward-looking estimates of how your business will perform financially over a defined period, typically 18 to 36 months. They cover three core outputs: revenue, expenses, and cash flow. Unlike a business plan narrative, projections put specific numbers behind your strategy. They answer questions like: when do we break even? How many months of runway do we have? What happens to margins if churn doubles?
The important distinction is between top-down and bottom-up projections. A top-down projection starts with market size ("The TAM is $10B, we'll capture 1%"). It sounds impressive and tells investors almost nothing. A bottom-up projection starts with your unit economics: 50 customers in month one, growing 12% monthly, at $200 ARPU, with $85 in direct costs per customer. Each assumption is testable, which is exactly what makes it useful.
Why Do Investors Care About Your Projections?
Here's the thing: investors know your projections will be wrong. Every early-stage forecast misses, usually by a wide margin. So why do they still ask for one?
Because the projections reveal how you think. A founder who builds projections from real assumptions (conversion rates from their beta, salary benchmarks for their market, churn from early cohorts) demonstrates operational depth. A founder who plugs in optimistic round numbers reveals the opposite.
Three things investors evaluate when they open your model:
- Internal consistency. Does ending cash in month 6 equal starting cash in month 7? Does revenue minus costs actually equal the margin you claim? If the rows don't reconcile, nothing else matters.
- Assumption grounding. Are your growth rates pulled from comparable companies, your own early data, or thin air? The best projections cite their sources.
- Sensitivity awareness. Do you know which two or three assumptions drive 80% of the outcome? Can you explain what happens when they move?
How to Build Startup Financial Projections
Step 1: Define Your Core Assumptions
Every projection starts with an assumptions layer. This is where you document the inputs that drive every other number. For a typical startup, the critical assumptions include:
- Customer acquisition: how many new customers per month, by channel
- Pricing: average revenue per customer or per unit
- Churn: monthly percentage of customers (or revenue) lost
- Cost scaling: when you need to hire, at what salary, and for which roles
- Gross margin: direct costs as a percentage of revenue
Keep this layer separate from your calculations. When an investor asks "what if churn is 8% instead of 5%?", you should be able to change one cell and watch everything else update. That is the whole point of separating assumptions from formulas.
Step 2: Build Revenue Projections Bottom-Up
Start with customers, not dollars. In month one, you have X paying customers at Y average revenue per account. Each month, add new customers from acquisition, subtract churned customers, and multiply the remaining base by ARPU. This gives you monthly recurring revenue that traces directly back to testable assumptions.
Monthly Revenue = Active Customers × ARPU
Active Customers = Prior Month Customers + New Customers - Churned Customers
Churned Customers = Prior Month Customers × Monthly Churn Rate
If you are pre-revenue, base your customer acquisition assumptions on your pipeline, beta sign-ups, or comparable companies at the same stage. Label these clearly as assumptions, not projections. Investors will respect the honesty.
For SaaS startups, expansion revenue matters too. If existing customers upgrade or buy additional seats, model that as a separate line item so you can see net revenue retention clearly.
Step 3: Model Your Cost Structure
Costs fall into two categories. Fixed costs (rent, salaries, software subscriptions) don't scale with revenue in the short term. Variable costs (hosting, payment processing, customer support per ticket) scale directly.
The biggest cost line for most startups is headcount. Build your hiring plan by quarter, listing each role, start month, and fully loaded salary (base plus benefits plus taxes, typically 1.25x to 1.4x base salary). This turns your cost model from a guess into a staffing plan that your operations team can actually execute against.
A common mistake is under-counting infrastructure costs for AI-heavy startups. Compute and API expenses can scale faster than revenue in the early months. Investors who have seen this pattern will probe for it.
| Cost Category | Examples | Scales With |
|---|---|---|
| Headcount | Engineering, sales, support | Hiring plan |
| Infrastructure | Cloud, APIs, compute | Usage and customers |
| Customer acquisition | Ads, content, events | Marketing budget |
| G&A | Legal, accounting, rent | Roughly fixed |
| COGS | Payment processing, hosting | Revenue |
Step 4: Build Your Cash Flow Projection
Revenue is not cash. A SaaS startup billing annually collects cash upfront but recognizes revenue monthly. A marketplace might not collect payment for 30 to 60 days after a transaction. Your cash flow projection must account for these timing differences.
The formula is straightforward:
Ending Cash = Starting Cash + Cash In - Cash Out
Monthly Burn Rate = Cash Out - Cash In
Runway (months) = Current Cash Balance / Monthly Net Burn
Burn rate and runway are the two numbers every founder should know by heart. If your runway drops below 6 months and you haven't started fundraising, you are already behind. Most Series A processes take 3 to 6 months from first meeting to wire, which means you need to start raising with at least 9 months of cash left.
Step 5: Run Scenarios
One set of projections is a guess. Three sets are a model. Build at minimum:
- Base case: your honest best estimate, grounded in current traction and reasonable growth
- Downside case: what happens if growth slows 30-50%, churn increases, or your next funding round takes 6 months longer than planned
- Upside case: what happens if a channel performs 2x better than expected
The downside case is the one investors pay the most attention to. It shows whether you survive long enough to course-correct. If your downside scenario has you running out of cash in month 10 with no clear path to profitability, that tells an investor exactly what they need to know about risk.
Calculate Your Startup Runway
Startup Runway Calculator
Estimate how many months your cash will last
Want to model this over 36 months with scenarios? Try Revenue Map free →
What Should Projections Look Like by Stage?
These ranges reflect what investors typically expect to see. They are starting points, not rules. Your vertical, business model, and geography all shift what "reasonable" looks like.
| Metric | Pre-Seed | Seed | Series A |
|---|---|---|---|
| Projection horizon | 18 months | 18-24 months | 36 months |
| Revenue detail | Monthly, 3-5 line items | Monthly, 5-10 line items | Monthly, 10+ line items |
| Cost detail | 5-8 categories | 8-12 categories | Full P&L |
| Scenarios | 2 (base + downside) | 2-3 | 3+ |
| Headcount plan | Key hires only | Department level | Role level |
| Break-even timeline | Optional | Shown | Required |
Common Mistakes in Startup Projections
-
Starting top-down. "We'll capture 1% of a $50B market" is not a projection. It is an aspiration without a mechanism. Build from unit economics, and let the market size serve as a ceiling check, not a starting point.
-
Ignoring cash timing. Your P&L might show profitability in month 14, but if you bill quarterly in arrears and pay salaries biweekly, your cash position tells a different story. Always model cash flow separately from revenue recognition.
-
Linear cost scaling. Costs don't scale linearly. You will need step-function hires (a second engineer, a first salesperson, a finance lead) at thresholds that are hard to predict. Build your hiring plan in steps, not smooth curves.
-
Forgetting to revisit. The best projection is the one you update monthly. Compare actual performance against your forecast, adjust the assumptions that were off, and re-run your scenarios. A model that sits in a drawer after fundraising is wasted work.
Key Takeaways
- Build bottom-up from unit economics. Customers times price minus costs. Every other approach is a shortcut that investors will see through.
- Separate assumptions from calculations. One input layer, deterministic formulas everywhere else. If you can't change one assumption and watch everything update, your model is broken.
- Three scenarios minimum. Base, downside, and upside. The downside case matters most to investors because it shows whether you survive mistakes.
- Model cash, not just revenue. Runway depends on when cash arrives and when it leaves, not when revenue is recognized.
- Update monthly. A projection is only useful if it reflects current reality. Compare actuals to forecast and adjust. Build your first model with Revenue Map: it takes less than five minutes.
Related Articles
Financial Projections Template: What to Include
Build a financial projections template with revenue forecasts, cost structure, cash flow, and scenario analysis. Includes formulas, benchmarks, and a free calculator.
Financial Forecasting for Startups: A Practical Guide
Learn how to build and maintain startup financial forecasts. Covers five proven methods, re-forecasting cadence, accuracy benchmarks, and a free calculator.
Revenue Forecast Template for Startups (2026)
Build a revenue forecast from scratch. Grab our template with MRR growth formulas, churn adjustments, and expansion revenue built in.