Revenue Forecast Template for Startups (2026)
A revenue forecast template projects your monthly or annual revenue using assumptions about customer acquisition, churn, and expansion. For SaaS startups, build it bottom-up: multiply new customers by average revenue per account, subtract churned revenue, and add expansion from upsells.
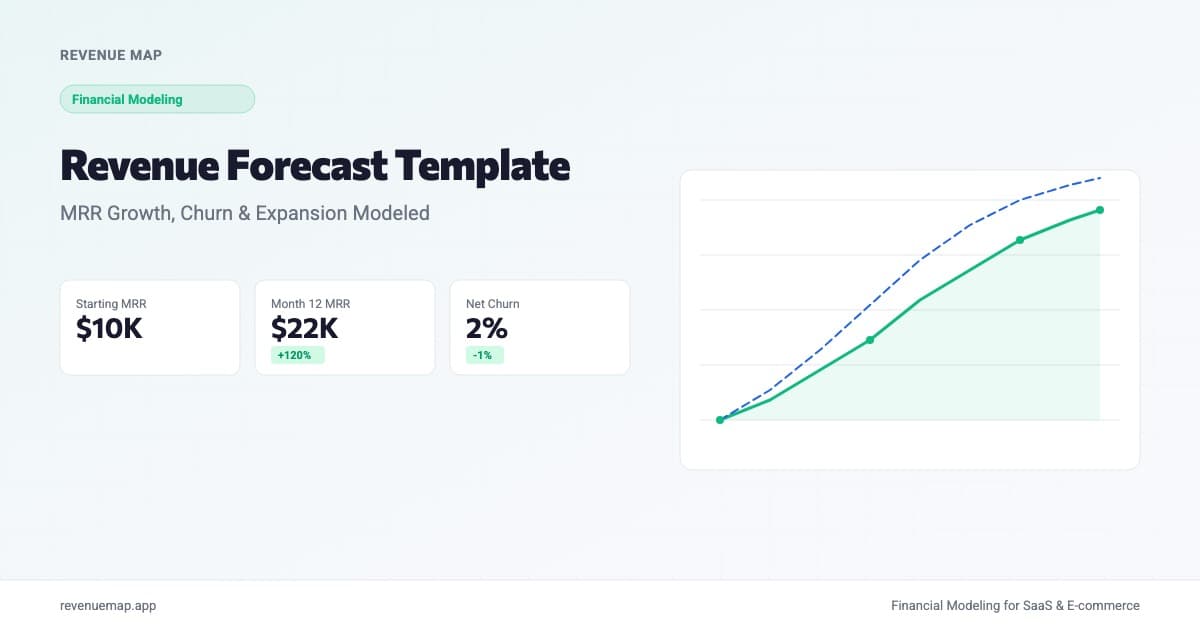
A revenue forecast template helps you project how much money your startup will earn each month based on assumptions about customer acquisition, churn, and pricing. Unlike a sales forecast (which tracks pipeline deals), a revenue forecast models recurring revenue over time, capturing the compounding effects of retention and expansion that drive subscription businesses.
Why does this matter right now? In August 2026, Lovable confirmed it had reached $500 million in annualized revenue and raised another $400M at a $13.3B valuation. That trajectory did not happen by accident. Behind every high-growth company is a revenue model that ties assumptions to outcomes, month by month. Whether you are forecasting $10K MRR or $10M, the mechanics are the same.
What Is a Revenue Forecast?
A revenue forecast is a forward-looking estimate of how much revenue your business will generate over a defined period. For startups, this usually means projecting monthly revenue for 12 to 24 months using bottom-up assumptions: how many customers you expect, what they pay, how many leave, and how many upgrade.
The forecast is not a guess. It is a model with testable inputs. When one assumption changes (say, churn doubles), you should be able to see exactly how that flows through to revenue in month 18. That traceability is what makes it useful for fundraising, hiring decisions, and cash planning.
Revenue Forecast vs Sales Forecast
Founders sometimes treat these as interchangeable. They are not. The difference matters for any business with recurring revenue.
| Dimension | Revenue Forecast | Sales Forecast |
|---|---|---|
| What it measures | Total recognized revenue per period | Expected deal closings |
| Primary inputs | MRR, churn rate, expansion rate, ARPU | Pipeline value, close rate, sales cycle |
| Time horizon | 12-36 months, monthly | Current quarter or pipeline window |
| Best for | Subscription/recurring businesses | Transactional or enterprise sales |
| Captures churn? | Yes, core component | No, assumes revenue is final at close |
| Captures expansion? | Yes (upsells, cross-sells) | Only if tracked as new deals |
A sales forecast template is the right tool if you sell one-time products or need pipeline visibility for sales management. A revenue forecast is what you need for financial modeling, investor reporting, and runway calculations in a recurring-revenue business.
How to Build a Revenue Forecast: Step by Step
Step 1: Define Your Revenue Model
Start by identifying how your business makes money. The most common startup revenue models:
- Subscription (SaaS): monthly or annual recurring fees. Project MRR.
- Usage-based: revenue scales with consumption (API calls, transactions). Project volume times price per unit.
- Hybrid: base subscription plus usage or transaction fees. Project each stream separately.
- Transactional: one-time purchases. Project order volume times average order value.
Most startups operate on subscription or hybrid models. If you are building a SaaS company, your forecast should be built around monthly recurring revenue (MRR) as the core metric.
Step 2: Set Your Baseline
If you have existing revenue, your baseline is last month's MRR. If you are pre-revenue, estimate your launch month: how many customers do you expect on day one, and at what price point?
Baseline MRR = Current Customers × Average Revenue Per Account (ARPA)
For a pre-revenue startup, be honest. If your beta has 30 users at $49/month, your baseline is $1,470 MRR. Do not inflate this number. Investors will ask where it came from.
Step 3: Model New Customer Acquisition
This is the growth engine of your forecast. There are two approaches:
Bottom-up (preferred): Estimate monthly leads, multiply by conversion rate, and multiply by ARPA.
New MRR = Monthly Leads × Conversion Rate × ARPA
Growth-rate based: Apply a monthly growth rate to your starting customer count. This is simpler but less grounded. If you use this method, justify your assumed rate. The benchmark for seed-stage SaaS is 10-20% month-over-month MRR growth. Very few companies sustain above 15% for more than 12 months.
Step 4: Account for Churn and Expansion
Here is where most first-time forecasts fall short. Revenue does not only grow. Every month, some customers leave (churn) and some customers pay more (expansion).
Churned MRR = Starting MRR × Monthly Churn Rate
Expansion MRR = Starting MRR × Monthly Expansion Rate
Then your net new MRR each month:
Net New MRR = New MRR + Expansion MRR - Churned MRR - Contraction MRR
A typical early-stage SaaS company sees 3-7% monthly logo churn and 1-3% expansion revenue from upsells and seat growth. If your forecast shows zero churn, it is not a forecast. It is a wish.
Net revenue retention (NRR) captures the combined effect: an NRR above 100% means existing customers generate more revenue over time even without any new sales. The strongest SaaS companies, the ones commanding 20x+ revenue multiples, typically run NRR above 120%.
Step 5: Project Monthly Revenue
With your inputs defined, build a month-by-month table:
| Month | Starting MRR | New MRR | Expansion | Contraction | Churned | Ending MRR |
|---|---|---|---|---|---|---|
| 1 | $10,000 | $2,000 | $300 | -$100 | -$500 | $11,700 |
| 2 | $11,700 | $2,340 | $351 | -$117 | -$585 | $13,689 |
| 3 | $13,689 | $2,738 | $411 | -$137 | -$684 | $16,017 |
Each month's ending MRR becomes the next month's starting MRR. The formula:
Ending MRR = Starting MRR + New MRR + Expansion MRR - Contraction MRR - Churned MRR
Over 12 months, even modest assumptions compound. A startup adding $2,000 in new MRR per month with 5% churn and 3% expansion reaches roughly $22,000 MRR by month 12 (not $34,000, which is what you get if you ignore churn). That gap is the difference between a credible forecast and an embarrassing one.
Calculate Your Monthly Revenue Forecast
MRR Forecast Calculator
Project your monthly recurring revenue with growth and churn
Want to model this over 36 months with scenarios? Try Revenue Map free →
Revenue Forecast Benchmarks by Stage
Not sure if your projections look reasonable? These benchmarks reflect what investors typically expect at each stage, based on public SaaS data and the models founders build on our platform.
| Stage | Revenue Range | Typical MoM Growth | Acceptable Churn | Expansion Rate |
|---|---|---|---|---|
| Pre-seed | $0-$50K MRR | 15-25% | 8-12% | 0-1% |
| Seed | $50K-$200K MRR | 10-18% | 5-8% | 1-3% |
| Series A | $200K-$1M MRR | 6-12% | 3-6% | 2-4% |
| Series B+ | $1M+ MRR | 3-8% | 2-4% | 3-5% |
The honest answer: early-stage numbers vary wildly. A company like Lovable growing from zero to $500M in annualized revenue in roughly two years represents an extreme outlier. Your forecast does not need to look like that. It needs to be internally consistent and grounded in assumptions you can defend.
One nuance worth flagging: churn rate tends to decrease as companies mature (better product-market fit, stickier customers, dedicated success teams), while expansion rate tends to increase (more upsell surface area, usage-based components). Model these trends rather than holding both rates flat for 24 months.
Running Scenarios
A single-line forecast is dangerous. Build at least three scenarios:
- Base case: your best estimate. Use actual metrics where available, conservative extrapolations where not.
- Optimistic case: increase new MRR by 30-50%, reduce churn by 20-30%. This is your "everything works" scenario.
- Pessimistic case: cut new MRR by 30-50%, increase churn by 30-50%. This tells you when cash runs out if things go sideways.
The pessimistic scenario is the one that matters most for runway planning. If your downside case shows you hitting zero cash in month 10, you need to start fundraising or cutting costs now, not when month 8 arrives.
Common Revenue Forecasting Mistakes
-
Ignoring churn entirely. Every subscription business has churn. If your forecast projects straight-line growth with no customer losses, it will overshoot by 30-50% within a year. Build churn in from month one.
-
Confusing bookings with revenue. Signing a $120K annual contract does not mean $120K in revenue this month. For SaaS companies, revenue is recognized monthly ($10K/month for 12 months). Your forecast should track recognized revenue, not bookings, unless you are modeling cash flow specifically.
-
Using top-down market sizing. "The market is $50B, we will capture 0.1%" tells you nothing. Revenue forecasts should be built bottom-up from customer counts and pricing. Every input should be a number you can test, measure, or benchmark.
Key Takeaways
- A revenue forecast projects recurring revenue month by month, accounting for growth, churn, and expansion. It is distinct from a sales forecast.
- Build bottom-up: start with customers times price, then layer in acquisition, churn, and expansion assumptions.
- Always run at least three scenarios (base, optimistic, pessimistic). The pessimistic case drives your runway and fundraising timeline.
- Benchmark your assumptions against stage-appropriate data. Seed-stage SaaS targets 10-20% month-over-month MRR growth with 5-8% churn.
- Your forecast will be wrong. That is fine. The value is in the structure: when assumptions change, you can see exactly how the outcome shifts.
Ready to build your revenue forecast? Start with Revenue Map's financial modeling tools and generate your first projection in minutes.
Related Articles
Financial Forecasting for Startups: A Practical Guide
Learn how to build and maintain startup financial forecasts. Covers five proven methods, re-forecasting cadence, accuracy benchmarks, and a free calculator.
Financial Projections Template: What to Include
Build a financial projections template with revenue forecasts, cost structure, cash flow, and scenario analysis. Includes formulas, benchmarks, and a free calculator.
Startup Financial Projections: How to Build Them
Learn how to build startup financial projections step by step. Covers revenue models, cost structure, cash flow, benchmarks, and a free runway calculator.