Restaurant Business Plan: Financials That Get Funded
A restaurant business plan should include startup costs of $175,000 to $750,000, revenue projections built from daily covers times average check, and a 12-month cash flow forecast. Lenders require a debt service coverage ratio of 1.25x or higher to approve the loan.
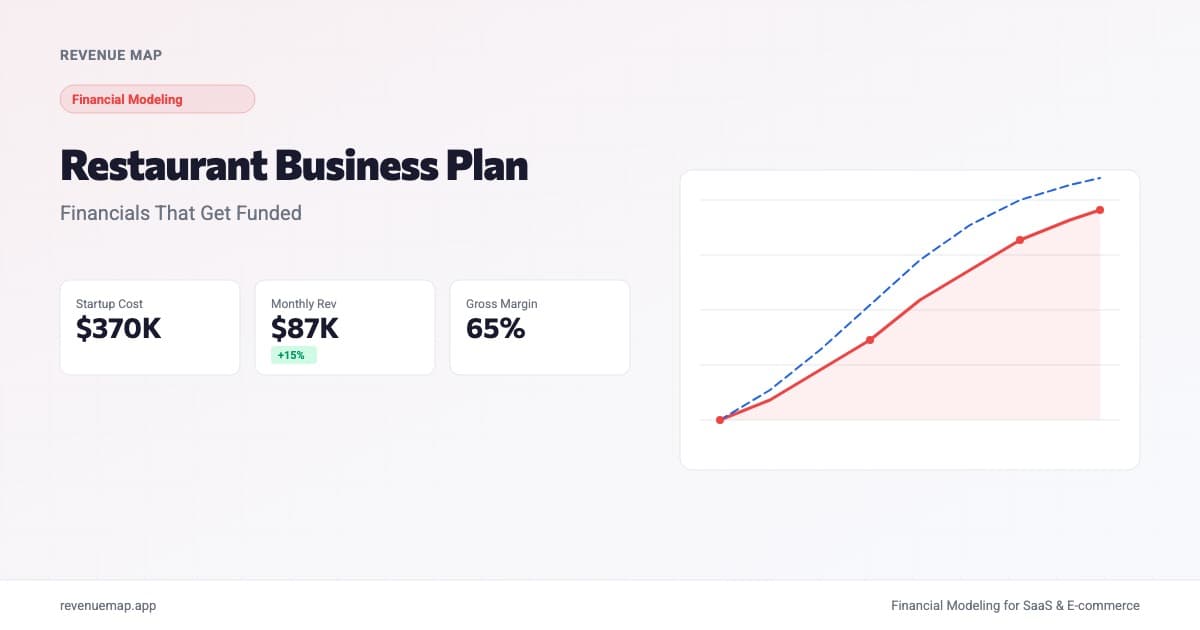
A restaurant business plan needs a financial section built on real numbers, not optimistic guesses about how many covers you will serve on day one. Lenders approve loans based on projected cash flow, a realistic startup cost breakdown, and proof that the restaurant can cover its debt payments with room to spare. The concept matters, but the numbers close the deal.
This week's headlines underscore why. A Qdoba franchisee defaulted on a $20 million loan after its 41-location operation couldn't service the debt. Marmalade Cafe in Los Angeles filed Chapter 11 bankruptcy, shrinking from seven locations to four. And Red Lobster continues closing locations in a post-bankruptcy restructuring. These are established concepts where the financial math stopped working. Whether you are opening a neighborhood bistro or pitching an SBA lender on your first location, the financial section of your plan is where you prove your math does work.
Here is how to build it with the actual numbers lenders expect to see.
How Much Does It Cost to Open a Restaurant?
Startup costs for a restaurant vary dramatically by concept. A small counter-service restaurant with minimal buildout might launch for $175,000. A full-service restaurant with a bar program, commercial kitchen, and custom interior can exceed $750,000.
Here is a realistic breakdown for a 2,500-square-foot full-service restaurant:
| Category | Low Estimate | Mid Estimate | High Estimate |
|---|---|---|---|
| Leasehold improvements | $50,000 | $125,000 | $250,000 |
| Kitchen equipment | $40,000 | $75,000 | $150,000 |
| Furniture, fixtures, decor | $15,000 | $35,000 | $75,000 |
| POS system and technology | $3,000 | $8,000 | $15,000 |
| Permits, licenses, liquor license | $5,000 | $15,000 | $40,000 |
| Initial inventory (food and bar) | $8,000 | $15,000 | $25,000 |
| Insurance (first year) | $5,000 | $10,000 | $18,000 |
| Marketing and signage | $5,000 | $12,000 | $25,000 |
| Working capital (6 months) | $40,000 | $75,000 | $150,000 |
| Total | $171,000 | $370,000 | $748,000 |
The working capital line is the one that saves restaurants. The first six months will include slow nights, unexpected equipment repairs, and staffing costs that exceed projections. A plan that spends every dollar on buildout with nothing left for operations is exactly the scenario that leads to default. The startup cost calculator adjusts these figures by concept and location.
A fast-casual concept with no table service and a simpler kitchen typically launches in the $175,000 to $300,000 range. That lower capital requirement also means a smaller loan, which makes the approval math significantly easier.
How to Project Restaurant Revenue
Revenue projections for a restaurant need to be bottom-up and defensible. The formula is straightforward:
Monthly Revenue = Daily Covers × Average Check × Days Open per Month
The challenge is choosing inputs that a lender won't immediately discount. Here are industry benchmarks across restaurant types:
| Restaurant Type | Avg Check | Daily Covers | Days/Month | Monthly Revenue |
|---|---|---|---|---|
| Fast casual (counter service) | $14 | 150 | 30 | $63,000 |
| Casual dining (full service) | $28 | 120 | 26 | $87,360 |
| Upscale casual | $45 | 90 | 26 | $105,300 |
| Quick service (limited menu) | $10 | 200 | 30 | $60,000 |
| Neighborhood bistro (BYOB) | $35 | 70 | 25 | $61,250 |
Full-service restaurants generate higher monthly revenue than counter-service despite fewer covers because the average check carries the difference. Quick-service concepts compensate with volume and more operating days.
For your first year, model conservatively. Assume 50% to 60% of the daily covers above in months one through three, ramping to 80% by month six, and reaching full capacity around month nine to twelve. Lenders prefer realistic ramp-ups over day-one optimism. Our financial projections template guide covers the general framework for building these forecasts across business types.
Calculate Your Restaurant Revenue
Restaurant Revenue Calculator
Estimate your monthly and annual restaurant revenue
Restaurant Gross Margins and Cost Benchmarks
Gross margin in a restaurant tells you what is left after food and beverage costs. The industry typically reports this as the inverse of "food cost percentage," which is the metric most operators track daily.
| Restaurant Type | Food Cost % | Beverage Cost % | Blended Gross Margin |
|---|---|---|---|
| Fast casual | 28-32% | N/A | 68-72% |
| Casual dining | 28-35% | 18-24% | 62-68% |
| Upscale casual | 30-35% | 16-22% | 63-70% |
| Quick service | 25-30% | 20-25% | 70-75% |
Beverage programs with a bar license significantly improve blended gross margins because liquor, wine, and cocktails carry 75% to 82% margins. A restaurant doing 30% of revenue from beverages can push its blended margin several points above a food-only concept.
Net margins are thinner. After labor (25% to 35%), rent (6% to 10%), and other overhead, the average full-service restaurant nets 3% to 5%. Fast-casual concepts net 6% to 9% with fewer staff per revenue dollar.
That tight margin is precisely why lenders scrutinize restaurant plans so carefully. A 3% swing in food costs or a 10% miss on projected covers can push the operation from profitable to cash-negative. Track food cost weekly, not monthly.
12-Month Cash Flow for a New Restaurant
The cash flow forecast is the section that determines whether your plan gets funded. Here is a simplified 12-month projection for a casual dining restaurant with $370,000 in startup costs, a $275,000 SBA loan, and $95,000 in owner equity.
| Month | Revenue | COGS (32%) | Labor (30%) | Other OpEx | Loan Payment | Net Cash Flow | Cumulative Cash |
|---|---|---|---|---|---|---|---|
| 1 | $43,680 | $13,978 | $13,104 | $12,000 | $3,200 | $1,398 | $51,398 |
| 2 | $52,416 | $16,773 | $15,725 | $12,000 | $3,200 | $4,718 | $56,116 |
| 3 | $61,152 | $19,569 | $18,346 | $12,200 | $3,200 | $7,837 | $63,953 |
| 6 | $78,624 | $25,160 | $23,587 | $12,800 | $3,200 | $13,877 | $97,461 |
| 9 | $87,360 | $27,955 | $26,208 | $13,200 | $3,200 | $16,797 | $148,852 |
| 12 | $87,360 | $27,955 | $26,208 | $13,500 | $3,200 | $16,497 | $198,143 |
Other operating expenses include rent, utilities, insurance, marketing, repairs, and supplies. The loan payment assumes a 10-year SBA 7(a) loan at 10.5% interest.
Notice the cumulative cash position stays well above zero throughout year one. That is what separates an approvable plan from a risky one. If your projection shows cumulative cash going negative in any month, you need more working capital, a phased opening, or a less capital-intensive concept.
Monitor your actual burn rate against this plan weekly. The gap between projected and actual costs shows up fastest in labor and food. Catching a 3% overrun in month two is manageable; discovering it in month six means five months of lost cash.
What Do Lenders Check in a Restaurant Business Plan?
If you are applying for an SBA loan or conventional business loan, the financial section carries the decision. Our full guide on writing a business plan for a business loan covers the broader framework, but here are the five things restaurant lenders focus on:
-
Debt service coverage ratio (DSCR). Can the restaurant generate enough cash to cover loan payments with a cushion? Most lenders require 1.25x or higher. In the year-one example above, stabilized monthly operating income of roughly $19,700 against a $3,200 payment gives a DSCR above 6x. Even in the ramp-up months, coverage stays above 1.25x. You can run the calculation on our break-even calculator to test different scenarios.
-
Use of funds. Every dollar of the loan must have a specific destination. Not "kitchen equipment" but "six-burner range ($4,200), walk-in cooler ($8,500), commercial dishwasher ($3,800)." The more detail, the more credibility.
-
Owner equity. SBA loans typically require 10% to 20% owner equity. In the example above, $95,000 on a $370,000 project is 26%, which exceeds the minimum and signals commitment.
-
Comparable data. Anchor projections to numbers a loan officer can verify: per-square-foot revenue for your market, average checks for your concept category, and local labor benchmarks. Your numbers should be consistent with what a food truck business plan in the same market shows, adjusted for sit-down service.
-
Seasonality planning. A beach town or ski area restaurant projecting flat revenue across all twelve months will lose credibility instantly. Show the seasonal dip and prove your reserves cover it.
Common Mistakes in Restaurant Financial Plans
-
Projecting full capacity on opening night. No restaurant serves 120 covers on its first Wednesday. Ramp from 50% of capacity in month one to 80% by month six. Lenders will flag plans that skip this.
-
Underestimating labor costs. Labor runs 25% to 35% of revenue and is the hardest cost to control. Turnover runs 75% annually in full-service restaurants. Build a 2% to 3% buffer above your modeled number.
-
Ignoring pre-opening expenses. Rent during buildout, 2 to 4 weeks of staff training payroll, and soft-opening costs all hit before you serve your first paying customer.
-
No equipment contingency. A walk-in cooler compressor replacement costs $2,000 to $4,000. Budget $500 per month for maintenance reserves.
Key Takeaways
- Restaurant startup costs range from $175,000 for a simple counter-service concept to $750,000 for a full-service restaurant with a bar. Always include 6 months of working capital in your total.
- Build revenue projections from daily covers times average check times days open. A casual dining restaurant serving 120 covers at a $28 average check generates roughly $87,000 per month at full capacity.
- Gross margins of 62% to 72% are typical, but net margins of 3% to 9% leave very little room for error. Track food costs and labor weekly.
- Your 12-month cash flow forecast should show cumulative cash that never goes negative after funding. This is the single most scrutinized section in any restaurant loan application.
- Lenders want a DSCR of 1.25x or higher. Build your projections so that even the weakest month clears this threshold.
Ready to build the financial model behind your restaurant business plan? Start with Revenue Map, select your restaurant type, and get a three-year projection you can hand to a lender. Free, two minutes.
Related Articles
Beauty Supply Store Business Plan: Costs and Projections
Build the financial section of your beauty supply store business plan with real startup costs, revenue projections, and the cash flow forecast lenders require.
Salon Suite Business Plan: Costs and Projections
Build the financial section of your salon suite business plan with startup costs, rental revenue projections, and the cash flow lenders check.
Hot Dog Cart Business Plan: Costs and Projections
Build the financial section of your hot dog cart or food cart business plan with startup costs, revenue projections, and the cash flow lenders check.