SaaS Valuation Multiples: 2026 Benchmarks
SaaS valuation multiples express a company's enterprise value as a multiple of its annual recurring revenue. In 2026, median public SaaS trades at 6 to 8 times ARR, while high-growth companies with strong net revenue retention can command 15 times ARR or more.
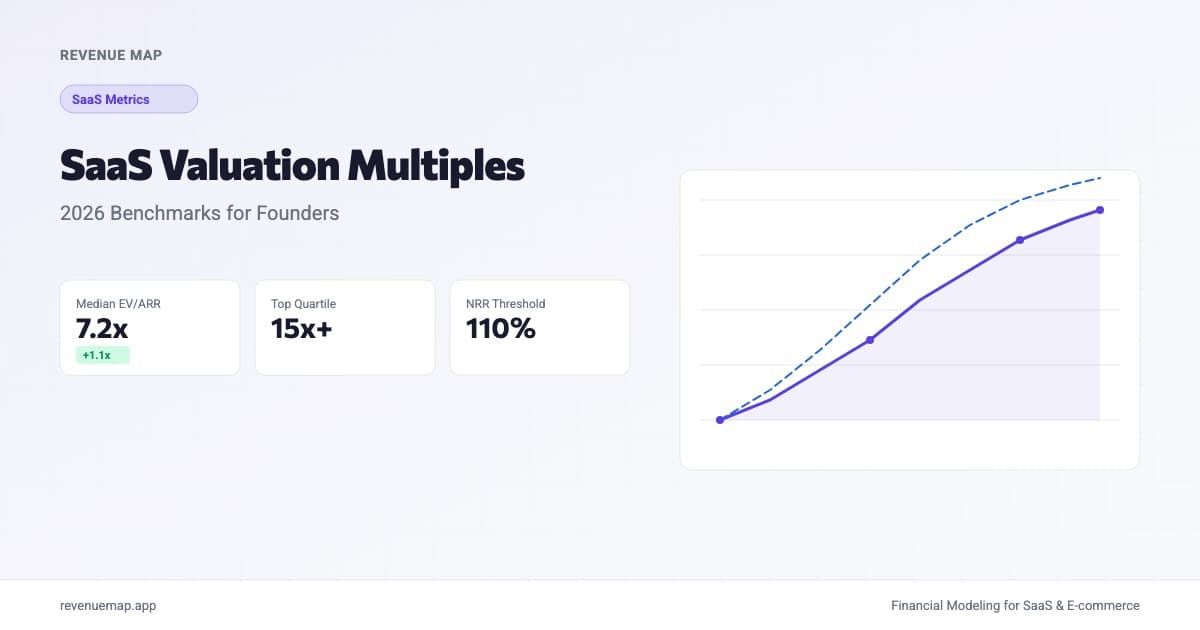
SaaS valuation multiples measure what buyers and investors will pay per dollar of recurring revenue. The standard formula divides enterprise value by annual recurring revenue, producing a single number that captures growth expectations, margin profile, and market sentiment in one ratio. In 2026, median public SaaS trades at roughly 6 to 8 times ARR, while the fastest growers command 15x or more.
These multiples matter right now because the M&A market is accelerating. Three B2B companies were each acquired for approximately $3 billion within a single month: Salesforce bought Fin (formerly Intercom) for $3.6B, Autodesk acquired MaintainX, and Cognite found a buyer at a similar price. According to SaaStr's analysis, all three acquirers paid a premium for the same thing: proprietary data assets that power AI capabilities. If you're building a startup and thinking about fundraising or exit scenarios, understanding what drives these multiples is no longer optional.
What Are SaaS Valuation Multiples?
A SaaS valuation multiple is a ratio that expresses enterprise value relative to recurring revenue. The most common variant is EV/ARR (enterprise value divided by annual recurring revenue), though EV/Revenue is used when a company has significant non-recurring revenue streams.
The logic is straightforward. Recurring revenue is predictable, high-margin, and compounds over time. Investors pay a premium for that predictability compared to one-time revenue businesses. A 10x ARR multiple means the market values each dollar of your annual recurring revenue at ten dollars of enterprise value.
Two important distinctions to keep in mind. First, enterprise value is not the same as market cap or valuation headline. Enterprise value equals equity value plus debt minus cash. When a VC leads a $20M round at a $100M post-money valuation, the "multiple" investors cite is based on that $100M figure, but the true EV adjusts for the cash that just entered the balance sheet. Second, multiples based on forward ARR (next twelve months projected) are typically lower than trailing ARR multiples because the denominator is larger. Always clarify which basis you're comparing against.
How to Calculate Your Valuation Multiple
The formula is simple:
EV/ARR Multiple = Enterprise Value / Annual Recurring Revenue
Worked example: your startup raises a Series A at a $40M post-money valuation. You have $500K in the bank post-close and $4M in ARR. Your EV is roughly $39.5M ($40M minus $500K cash), and your multiple is $39.5M / $4M = 9.9x ARR.
For a quick sanity check, many founders use a shorthand that ties growth rate directly to the multiple. The "growth-adjusted multiple" divides EV/ARR by the year-over-year growth rate. A company at 10x ARR growing 100% YoY has a growth-adjusted multiple of 0.10x, while one at 10x growing 30% has a growth-adjusted multiple of 0.33x. Lower is cheaper relative to growth.
Calculate Your Implied Valuation
SaaS Valuation Calculator
Estimate your implied enterprise value based on ARR and revenue multiple
Want to model this over 36 months with scenarios? Try Revenue Map free →
2026 Valuation Benchmarks by Stage
Multiples vary dramatically depending on where a company sits in its lifecycle, how fast it grows, and how efficiently it does so. The table below reflects ranges observed across public SaaS data and private market benchmarks.
| Stage | Typical ARR | Median Multiple | Top Quartile | Key Driver |
|---|---|---|---|---|
| Seed | Under $1M | 15-30x | 40x+ | Team, TAM, early traction |
| Series A | $1M-$5M | 10-20x | 25x+ | Growth rate, retention |
| Series B | $5M-$20M | 8-15x | 20x+ | Unit economics, NRR |
| Growth / Series C+ | $20M-$100M | 8-12x | 18x+ | Rule of 40, path to profit |
| Public SaaS (median) | $100M+ | 6-8x | 15x+ | Growth + margin composite |
A few patterns are worth calling out. Early-stage multiples look inflated because the denominator (ARR) is small. A seed-stage company at $200K ARR raising at a $6M valuation is technically at 30x, but investors are pricing the TAM and team, not the current revenue. By Series B, the multiple becomes more diagnostic because the revenue base is large enough to reflect product-market fit.
The current market is also splitting. SaaStr's Carta analysis shows that Bay Area startups captured 41.3% of the $124 billion invested through Carta from July 2025 to June 2026, with AI companies taking 51% of every venture dollar. Capital is concentrating toward companies with AI-native products and strong data moats. If your startup has those characteristics, multiples are expanding. If it doesn't, expect compression.
What Drives Higher Multiples?
Not all SaaS companies at the same ARR command the same multiple. Five factors explain most of the variance.
1. Growth Rate
This is the single strongest predictor. Companies growing above 40% YoY consistently trade at 2 to 3 times the multiple of peers growing below 20%. The relationship is roughly linear in log terms: doubling your growth rate tends to add 50-80% to your multiple. This is why tracking your growth rate against benchmarks matters so much for fundraising positioning.
2. Net Revenue Retention
NRR above 110% signals that your existing customer base is a growth engine, not just a retention challenge. Acquirers and investors treat high-NRR businesses as compounding machines because each cohort of customers generates more revenue over time without additional acquisition spend. The three recent $3B acquisitions all had this in common: deep customer embedment that made switching costs high and expansion revenue predictable.
3. Gross Margins
SaaS gross margins above 70% are table stakes for premium multiples. Below 60%, the business starts to look more like a services company than a software company, and the multiple compresses accordingly. AI-heavy products face particular scrutiny here because inference costs can erode margins. Investors want to see a path to 75%+ gross margin even if the current number is lower.
4. Capital Efficiency
The Rule of 40 captures this: growth rate plus profit margin should exceed 40. But beyond that threshold, investors increasingly favor "efficient growth" profiles. A company growing 30% with 20% margins (Rule of 40 score: 50) often commands a higher multiple than one growing 60% with negative 25% margins (score: 35), because the first company can self-fund its growth. The days of growth-at-all-costs multiples are largely over.
5. Proprietary Data and AI Moats
This is the 2026 wildcard. The three $3B acquisitions SaaStr analyzed share a common thread: each company had built proprietary data assets that acquirers needed for AI capabilities. Fin (Intercom) had years of customer conversation data. MaintainX had industrial maintenance workflows. Cognite had operational technology data from energy and manufacturing. The premium these buyers paid wasn't just for the software or the revenue. It was for data that would be nearly impossible to replicate.
For founders, the implication is practical: if your product generates unique, structured data as a byproduct of usage, your valuation story just got stronger. Build that narrative into your pitch and your financial model.
How to Model Exit Scenarios
Your financial model should include at least two exit scenario views, one based on a revenue multiple and one based on a growth-adjusted multiple. Here's a simple framework:
Exit Valuation = Projected ARR at Exit × Expected Multiple
The nuance is in choosing the right multiple assumption. Most founders default to their last-round multiple and project it forward, which is dangerous. Multiples compress as companies mature (the stage table above makes that clear). If you raised your Series A at 15x and project a Series C exit at 15x, you're likely overstating the outcome.
A more realistic approach: anchor your multiple assumption to the median for your target exit stage, then adjust up or down based on your expected growth rate and NRR at that point. If you plan to be at $30M ARR growing 50% YoY with 115% NRR, you can reasonably model a 12-15x multiple. If growth decelerates to 25% with flat NRR, model 6-8x.
Build both scenarios in your SaaS financial model and show investors the range. This demonstrates maturity and gives your board a framework for evaluating acquisition offers against the alternative of continued growth.
Common Mistakes When Using Valuation Multiples
-
Comparing private and public multiples directly. Private multiples include an illiquidity premium (investors accept higher multiples partly because they can't sell easily). Don't benchmark your Series B multiple against public SaaS medians and conclude you're "undervalued."
-
Ignoring the denominator. A multiple is only as meaningful as the revenue it's applied to. If your ARR includes one-time implementation fees, annual true-ups from multi-year contracts, or usage revenue with high variance, the multiple overstates recurring value. Clean your ARR calculation before using it as the denominator.
-
Treating multiples as static. Your multiple today reflects today's growth, retention, and market conditions. Two quarters of decelerating growth can cut your multiple in half. Model multiple compression into your downside scenarios.
Key Takeaways
- The EV/ARR multiple is the standard yardstick for SaaS valuation. Median public SaaS trades at 6-8x, while top-quartile growers reach 15x or higher.
- Growth rate is the strongest predictor of your multiple, followed by net revenue retention, gross margins, and capital efficiency.
- Proprietary data assets are the 2026 multiplier. Three $3B acquisitions in a single month were driven by buyers paying premiums for data that powers AI capabilities.
- Model exit scenarios with stage-appropriate multiples, not your last-round multiple projected forward. Multiples compress as companies mature.
- Pair your valuation assumptions with efficiency metrics like the Rule of 40 to stress-test whether your projected multiple is realistic.
Your valuation story is only as credible as the model behind it. Build your SaaS financial model in Revenue Map to project ARR scenarios, benchmark your metrics against peers, and see what different exit multiples mean for your outcome.
Related Articles
SaaS Revenue Per Employee: 2026 Benchmarks
How much ARR should each employee generate? See 2026 SaaS revenue per employee benchmarks by stage and growth rate, with formulas and a free calculator.
SaaS Gross Margin: How to Calculate and Benchmark It
Learn how to calculate SaaS gross margin, what counts as COGS, and 2026 benchmarks by company stage. Includes a free calculator.
SaaS Unit Economics: Formulas and Benchmarks (2026)
Calculate SaaS unit economics with formulas for CAC, LTV, contribution margin, and payback. Includes 2026 benchmarks by stage and a free calculator.