CAC Payback Period: How to Calculate and Benchmark It
CAC payback period is the number of months it takes to earn back the cost of acquiring a customer. Calculate it by dividing your customer acquisition cost by the monthly gross profit per customer. A good benchmark for SaaS is 12 to 18 months.
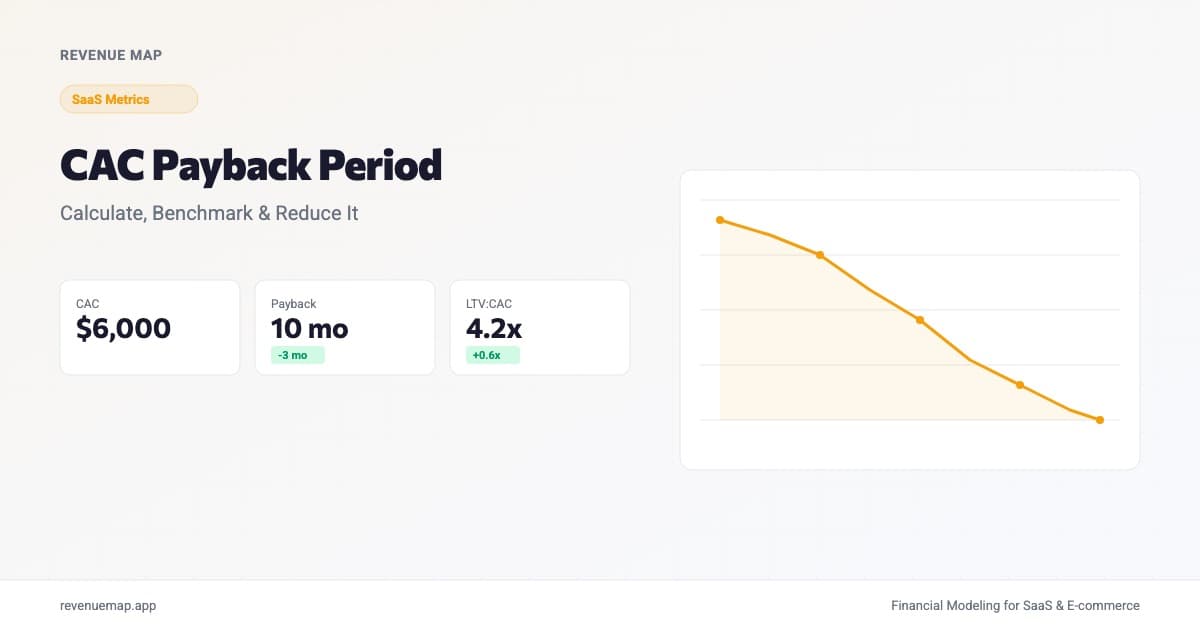
CAC payback period is the number of months it takes to earn back the cost of acquiring a customer through the gross profit that customer generates. Calculate it by dividing your customer acquisition cost by the monthly gross profit per account. For most SaaS companies, a healthy benchmark is 12 to 18 months, though the number varies significantly by stage, segment, and pricing model.
This metric has gained renewed relevance in 2026 as companies rethink how they deploy sales resources. SaaStr's latest analysis of AI-powered outbound makes a case that most teams put AI agents on their best leads, when the real unlock is putting them on the thousands of leads that human reps will never call. The implication for unit economics is direct: when AI handles the long tail of outbound at a fraction of the cost of a human SDR, your blended CAC drops and payback compresses. But only if you're measuring it correctly.
What Is CAC Payback Period?
CAC payback period is the time required for a customer to generate enough gross profit to cover the cost of acquiring them. It answers a question that raw CAC alone cannot: how long does your capital stay locked up before it starts working for you?
This distinction matters more than most founders realize. Two companies can have identical CAC numbers, say $6,000, and radically different payback profiles. Company A sells a $500/month product with 80% gross margins, so each customer generates $400/month in gross profit. Payback: 15 months. Company B sells a $200/month product with 60% gross margins, generating $120/month in gross profit. Payback: 50 months. Same CAC, completely different cash flow dynamics.
CAC payback is closely related to the LTV:CAC ratio, but it captures a dimension that LTV:CAC misses: timing. A company with a 5:1 LTV:CAC ratio and a 30-month payback period has excellent lifetime economics but a serious cash flow problem. The lifetime value is real, but the business needs to survive long enough to collect it.
How to Calculate CAC Payback Period
The standard formula:
CAC Payback (months) = CAC / (ARPA x Gross Margin %)
Where:
- CAC is the fully loaded customer acquisition cost (total sales and marketing spend divided by new customers acquired)
- ARPA is average revenue per account per month
- Gross Margin % is the percentage of revenue retained after cost of goods sold
Worked example: Your startup spent $180,000 on sales and marketing last quarter and acquired 30 new customers. Your CAC is $6,000. Each customer pays $800/month on average, and your gross margin is 75%. Monthly gross profit per customer is $800 x 0.75 = $600.
CAC Payback = $6,000 / $600 = 10 months
That 10-month payback means each customer becomes profitable by the end of their tenth month. Everything after that is profit contribution, which is why pairing this with your churn rate matters so much. If your median customer tenure is 8 months, a 10-month payback means you never recoup your investment on most customers.
Two important nuances. First, use gross profit, not revenue. Revenue-based payback calculations overstate how quickly you recover costs because they ignore the direct costs of serving each customer (infrastructure, support, onboarding). Second, make sure your CAC is fully loaded: include salaries, commissions, ad spend, tooling, and any other costs that exist only because you're acquiring customers.
Calculate Your CAC Payback Period
CAC Payback Period Calculator
Enter your acquisition cost and per-customer economics to calculate payback
Want to model this over 36 months with scenarios? Try Revenue Map free →
CAC Payback Benchmarks by Stage and Model
Payback expectations shift based on your company stage, customer segment, and business model. The table below reflects current benchmarks across the SaaS landscape.
| Stage / Segment | Strong | Average | Concerning |
|---|---|---|---|
| Seed (SMB SaaS) | Under 12 months | 12-18 months | Over 18 months |
| Series A (Mid-Market) | Under 15 months | 15-22 months | Over 24 months |
| Series B+ (Enterprise) | Under 18 months | 18-24 months | Over 30 months |
| Usage-Based SaaS | Under 9 months | 9-15 months | Over 18 months |
| E-commerce / DTC | Under 3 months | 3-6 months | Over 9 months |
A few patterns to note. Enterprise SaaS can tolerate longer payback periods because the contracts are larger, stickier, and come with net revenue retention rates that often exceed 120%. An 18-month payback on a customer who stays for 5+ years and expands 20% annually is a great investment.
Conversely, SMB SaaS with high monthly churn needs much shorter payback. If your average customer churns within 14 months and your payback is 16 months, you are systematically destroying value with every new acquisition. That is not a growth problem. It is a business model problem.
Usage-based pricing models tend to show shorter payback because customers ramp usage (and revenue) over time. The first month might generate $200, but by month six the same customer generates $600. That acceleration compresses payback in a way that flat-rate subscription models cannot match.
Why CAC Payback Matters More Than CAC Alone
CAC tells you what a customer costs. Payback tells you when you get it back. The distinction is critical for two reasons.
Cash flow and runway. Every customer you acquire ties up capital equal to their CAC for the duration of the payback period. If your payback is 18 months and you acquire 100 customers per month at $5,000 CAC, you have $9 million in capital locked up in unrecovered acquisition costs at any given moment. That is money you cannot spend on product, hiring, or anything else. For startups watching their burn rate, shortening payback by even a few months can materially extend runway.
Growth capacity. Shorter payback means faster capital recycling. A company with 6-month payback can theoretically reinvest recovered capital into new acquisition twice a year. A company with 24-month payback waits two years before that same dollar comes back. At scale, this difference determines how quickly you can grow without additional fundraising.
This is why investors increasingly ask about CAC payback alongside LTV:CAC. A SaaS financial model that shows 4:1 LTV:CAC but 28-month payback is telling investors that the economics are sound but the capital requirements are steep. That is a different conversation than 4:1 LTV:CAC with 10-month payback, which says "we can grow efficiently with modest capital."
How AI-Powered Outbound Is Compressing Payback
The SaaStr piece on AI agents highlights a pattern worth modeling: rather than replacing human SDRs on high-value leads, the companies seeing results are deploying AI on the leads their reps would never touch. The long tail of your lead database: old inbounds that went cold, low-score accounts, industries outside your ICP that might still convert at low volume.
According to SaaStr, this approach works because the alternative cost of those leads is zero. No human rep was going to call them. When an AI agent converts even a small percentage, the incremental CAC on those deals is very low (the cost of the AI tooling divided by conversions), which pulls your blended CAC down.
The impact on payback is straightforward to model. Say your human-sourced deals have a $6,000 CAC and your AI-sourced deals have a $1,500 CAC. If AI deals represent 20% of new customers, your blended CAC drops to $5,100. On $600/month gross profit per customer, payback shrinks from 10 months to 8.5 months. Scale AI deals to 40% of the mix and blended CAC falls to $4,200 with a 7-month payback.
The caveat: AI-sourced customers may have different retention profiles. If they churn faster because they were lower-intent leads to begin with, the payback improvement is real but the lifetime value may not hold up. Track cohort retention separately for human-sourced and AI-sourced customers before celebrating the blended numbers.
Common Mistakes When Measuring CAC Payback
Using Revenue Instead of Gross Profit
This is the most common error. Revenue-based payback flatters the number by ignoring cost of goods sold. If your gross margin is 70%, a revenue-based calculation understates your true payback by roughly 30%. For a company with $8,000 CAC and $1,000 ARPA, the revenue-based payback is 8 months. The gross-profit-based payback is 11.4 months. That three-month gap is the difference between "we have a tight payback" and "we might have a problem."
Ignoring Channel-Level Variation
Blended CAC payback hides the fact that some channels pay back in 4 months and others in 20. Organic leads typically have near-zero CAC and sub-month payback. Paid search might run 8 months. Enterprise outbound with a full AE cycle might run 18 months. If you only look at the blend, you cannot make informed decisions about where to allocate your next dollar.
Forgetting to Account for Churn
A 12-month payback period is meaningless if 40% of your customers churn before month 12. The effective payback is actually worse than 12 months for the cohort, because the churned customers never fully repaid their CAC. Compare your payback period against your retention curves by segment to see what percentage of customers actually survive long enough to pay back.
Treating CAC Payback as Static
Payback shifts as your business scales. Early-stage companies often have artificially low CAC because founders do the selling themselves. As you add sales teams, marketing spend, and overhead, CAC rises and payback stretches. Build dynamic CAC payback projections into your financial model that account for how acquisition costs will evolve at different growth rates.
Key Takeaways
- CAC payback period measures how many months until a customer's gross profit covers the cost of acquiring them, making it the definitive metric for acquisition efficiency
- Healthy SaaS payback ranges from 12-18 months for most stages, though enterprise can tolerate longer and SMB demands shorter due to churn dynamics
- Always calculate with gross profit, not revenue, to avoid understating your true payback by 20-40%
- AI-powered outbound on low-priority leads can compress blended CAC and shorten payback, but track retention cohorts separately to validate lifetime economics
- Compare payback to median customer tenure: if customers churn before payback, you are losing money on every acquisition regardless of what LTV:CAC says on a spreadsheet
Your CAC payback period determines how much capital you need to fund growth and how quickly you can reinvest. Model it alongside your full unit economics in Revenue Map to see exactly when each cohort turns profitable and stress-test how changes in CAC, pricing, or retention shift your trajectory.
Related Articles
SaaS Unit Economics: Formulas and Benchmarks (2026)
Calculate SaaS unit economics with formulas for CAC, LTV, contribution margin, and payback. Includes 2026 benchmarks by stage and a free calculator.
LTV to CAC Ratio: How to Calculate and Benchmark It
Learn how to calculate your LTV to CAC ratio, see what good looks like by stage and channel, and use it to make smarter growth spending decisions.
Customer Lifetime Value: How to Calculate LTV
Learn how to calculate customer lifetime value (LTV) with formulas, benchmarks by segment, and strategies to increase it for SaaS and e-commerce.