Break-Even Analysis: How to Calculate for Startups
Break-even analysis tells you how much revenue you need to cover all your costs. Calculate your break-even point by dividing total fixed costs by the contribution margin per unit. For SaaS startups, this typically means finding the number of paying customers needed to cover monthly burn.
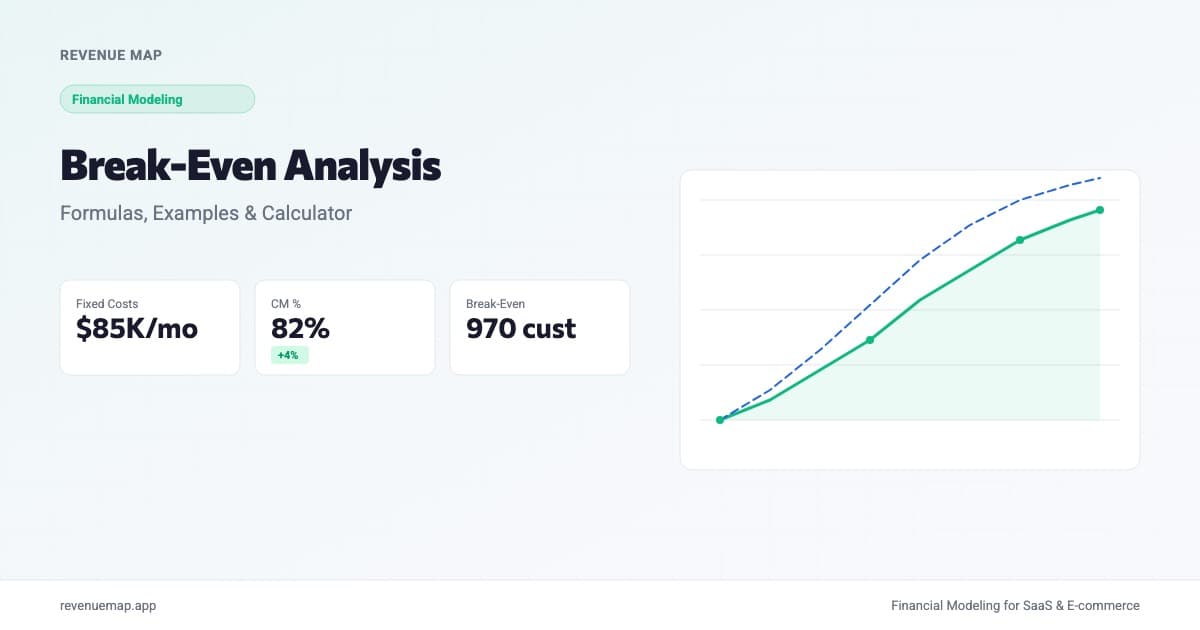
Break-even analysis tells you exactly how many units, customers, or dollars of revenue your business needs before it stops losing money. Calculate it by dividing your fixed costs by the contribution margin per unit (selling price minus variable cost per unit). It's one of the most fundamental tools in financial modeling, and if you're building a startup, it belongs in every board deck, fundraise model, and pricing decision.
The concept sounds simple, but the execution trips up a lot of founders. A recent example: SaaStr documented how they finally moved off Marketo after years of 12-20% annual price hikes with no new features. The decision to switch vendors is fundamentally a break-even calculation: does the upfront cost of migration (engineering time, data migration, retraining) pay back faster than the ongoing savings from lower pricing? That same logic applies to nearly every major startup decision, from hiring to infrastructure to product launches.
What Is Break-Even Analysis?
Break-even analysis is a financial modeling technique that calculates the point where total revenue equals total costs. At the break-even point, your business generates zero profit and zero loss. Every unit sold (or customer acquired) beyond that point contributes directly to profit.
The core formula works across business models:
Break-Even Point (units) = Fixed Costs / (Price per Unit - Variable Cost per Unit)
The denominator, price minus variable cost, is called the contribution margin. It represents how much each sale contributes toward covering your fixed costs. Once you've sold enough units to cover all fixed costs, you've reached break-even.
Here's the thing: most founders think of break-even as a one-time milestone. In practice, it's a moving target. Every time you hire, raise prices, add a product line, or take on new infrastructure costs, your break-even point shifts. The companies that model this well don't just calculate break-even once during fundraising. They recalculate it every quarter as part of their financial planning process.
Why Break-Even Analysis Matters for Startups
Break-even analysis is not just an academic exercise. It drives three critical decisions that every founder faces.
Fundraising and runway planning. Investors want to know when you'll stop burning cash. Your burn rate tells them how fast you're spending. Your break-even analysis tells them when the spending stops. These two metrics together define your runway narrative, and a credible break-even timeline is often the difference between closing a round and getting passed on.
Pricing decisions. If your contribution margin is too thin, no amount of growth will get you to profitability. Break-even analysis forces you to confront whether your pricing strategy actually works at scale. A SaaS product priced at $29/month with $15 in variable costs per customer needs twice as many customers to break even as one priced at $49/month with the same cost structure.
Make-or-buy decisions. Should you build that feature in-house or buy a vendor tool? Should you switch from one platform to another? Every vendor evaluation is a break-even calculation in disguise: compare the upfront switching cost against the monthly savings, and calculate how many months until the investment pays back.
How to Calculate Break-Even Point: Step by Step
Step 1: Identify Your Fixed Costs
Fixed costs are expenses that don't change based on sales volume. For startups, these typically include:
- Salaries and benefits (engineering, product, G&A)
- Office rent or coworking fees
- Core software subscriptions (not usage-based)
- Insurance, legal, and accounting retainers
- Base infrastructure costs (minimum cloud hosting)
Add these up on a monthly basis. For most seed-stage startups, monthly fixed costs range from $30,000 to $150,000 depending on team size and location.
Step 2: Calculate Variable Costs per Unit
Variable costs scale with each additional unit sold or customer served. Common variable costs include:
| Business Model | Typical Variable Costs |
|---|---|
| SaaS | Hosting per user, payment processing (2-3%), customer support time, third-party API calls |
| E-commerce | COGS, shipping, packaging, payment processing, returns handling |
| Marketplace | Payment processing, trust and safety review, seller support |
| Services | Contractor labor, project-specific tools, travel |
For SaaS companies, variable costs per customer are often low (high gross margins of 70-85%). For e-commerce, variable costs per order can consume 40-60% of the selling price.
Step 3: Determine Your Contribution Margin
Contribution Margin = Price per Unit - Variable Cost per Unit
Contribution Margin % = (Price - Variable Cost) / Price × 100
Say you run a SaaS product charging $99/month per customer. Your variable costs per customer are $18/month (hosting, support, payment processing). Your contribution margin is $81/month, or about 82%.
Step 4: Calculate the Break-Even Point
Break-Even Point (customers) = Monthly Fixed Costs / Monthly Contribution Margin per Customer
Using our example: if monthly fixed costs are $85,000 and contribution margin is $81/customer/month, you need roughly 1,050 paying customers to break even.
For e-commerce, the calculation uses orders instead of customers:
Break-Even Point (orders) = Monthly Fixed Costs / Contribution Margin per Order
Step 5: Calculate the Break-Even Revenue
Sometimes it's more useful to express break-even as a revenue target rather than a unit count:
Break-Even Revenue = Fixed Costs / Contribution Margin %
With $85,000 in fixed costs and an 82% contribution margin, break-even revenue is about $103,700/month. That's a concrete MRR target you can track against.
Calculate Your Break-Even Point
Break-Even Calculator
Find how many units or customers you need to break even
Want to model this over 36 months with scenarios? Try Revenue Map free →
Break-Even Benchmarks by Business Model
These benchmarks reflect typical ranges we've seen across early-stage companies. Your mileage will vary based on market, geography, and team composition, but they give you a frame of reference for whether your numbers are in the right ballpark.
| Metric | SaaS (B2B) | E-commerce (DTC) | Marketplace |
|---|---|---|---|
| Contribution Margin % | 75-85% | 35-55% | 60-75% |
| Typical Monthly Fixed Costs (Seed) | $50K-$120K | $20K-$60K | $40K-$100K |
| Break-Even Timeline | 18-36 months | 6-18 months | 24-48 months |
| Break-Even MRR/Revenue | $80K-$160K | $50K-$150K | $60K-$140K |
One caveat: these timelines assume you're growing. A flat business with high fixed costs never reaches break-even. The break-even calculation assumes you can sustain a growth rate that gets you to the required unit volume within your runway.
Break-Even Analysis for SaaS: A Worked Example
Let's walk through a concrete SaaS scenario.
Assumptions:
- Monthly fixed costs: $95,000 (8-person team, cloud infra, tools)
- ARPU: $120/month
- Variable cost per customer: $22/month (hosting, support, Stripe fees)
- Contribution margin: $98/month (82%)
- Current customers: 400
- Monthly net new customers: 45
Break-Even Customers = $95,000 / $98 = 970 customers
Months to Break-Even = (970 - 400) / 45 = ~13 months
That 13-month timeline is credible for a seed-stage company with 18 months of runway. But what if you need to hire two more engineers, adding $30,000/month to fixed costs?
New Break-Even = $125,000 / $98 = 1,276 customers
New Timeline = (1,276 - 400) / 45 = ~19 months
Suddenly you're pushing against your runway limit. This is exactly why break-even analysis matters: it quantifies the trade-off between investing in growth (more hires) and reaching profitability. If you're modeling this for a fundraise, build a version in Revenue Map so you can run scenarios and present them to investors.
Common Break-Even Mistakes to Avoid
-
Forgetting to include all fixed costs. Founders often model salaries but miss benefits (add 20-30%), SaaS subscriptions ($2,000-$10,000/month for a typical startup), and the founder's own salary. If your break-even model doesn't include compensation for every person on the team, it's fictional.
-
Treating variable costs as fixed. Cloud hosting often has a base cost (fixed) plus a per-user component (variable). Payment processing is purely variable. Support costs are semi-variable: you need a baseline team, but each incremental 100 customers adds load. Split costs accurately or your contribution margin will be wrong.
-
Ignoring the time dimension. Break-even in units is useful, but break-even in months is what determines whether you survive. A company that needs 500 customers to break even but only adds 10/month has a 50-month timeline. That's not a business plan; it's a slow wind-down. Always pair unit break-even with a realistic growth assumption.
-
Using break-even as a one-time calculation. Your cost structure changes every quarter. New hires, price changes, vendor switches, expansion into new markets: all of these shift the break-even point. Model it as a rolling target, not a fixed milestone.
When to Use Break-Even Analysis Beyond Launch
Break-even analysis isn't just for new companies. It's the right tool any time you're evaluating a significant cost or revenue change:
New product lines. What volume does the new product need to justify its dedicated headcount and marketing budget?
Vendor switches. If you're evaluating a platform migration (like the Marketo-to-Salesforce move that SaaStr described), frame it as break-even: migration cost divided by monthly savings equals payback months.
Pricing changes. If you raise prices by 20%, some customers will churn. Break-even analysis tells you the maximum churn you can absorb before the price increase becomes a net negative. This connects directly to your customer lifetime value and churn rate models.
Market expansion. Entering a new geography means new fixed costs (localization, compliance, local team). How many customers in that market do you need before the expansion pays for itself?
Key Takeaways
- Break-even point equals fixed costs divided by contribution margin. For SaaS, that translates to the number of paying customers needed to cover monthly burn.
- Always express break-even in both units and time. A break-even point of 1,000 customers means nothing without a growth rate to show when you'll reach it.
- Recalculate quarterly as your cost structure evolves. Every hire, price change, or vendor switch moves the target.
- High contribution margins (typical in SaaS at 75-85%) mean lower break-even volume, which is why software businesses are attractive to investors despite high upfront costs.
- Use break-even analysis for every major financial decision, not just launch planning. Vendor switches, new hires, pricing changes, and market expansion all have break-even math behind them.
Ready to model your break-even scenarios? Build your financial model with Revenue Map and see exactly when your startup crosses into profitability.
Related Articles
Sales Forecast Template: How to Build One
Learn how to create a sales forecast template for your startup. Step-by-step formulas, benchmarks, and a calculator to project revenue from pipeline data.
Robotics Startup Financial Model: Costs, Margins, R&D
Build a financial model for a robotics startup. Covers BOM costs, R&D burn, manufacturing margins, and the unit economics investors need to see.
Construction Tech Financial Model for Startups
Build a construction tech financial model with project revenue, bid win rates, and contractor unit economics. Includes benchmarks and a revenue calculator.