SaaS Sales Capacity Model: Plan Reps, Quotas, Revenue
A SaaS sales capacity model forecasts revenue by multiplying the number of ramped reps by their expected quota attainment. In 2026, top-quartile annual quotas are $750K for SMB, $1.35M for mid-market, and $2.25M for enterprise AEs.
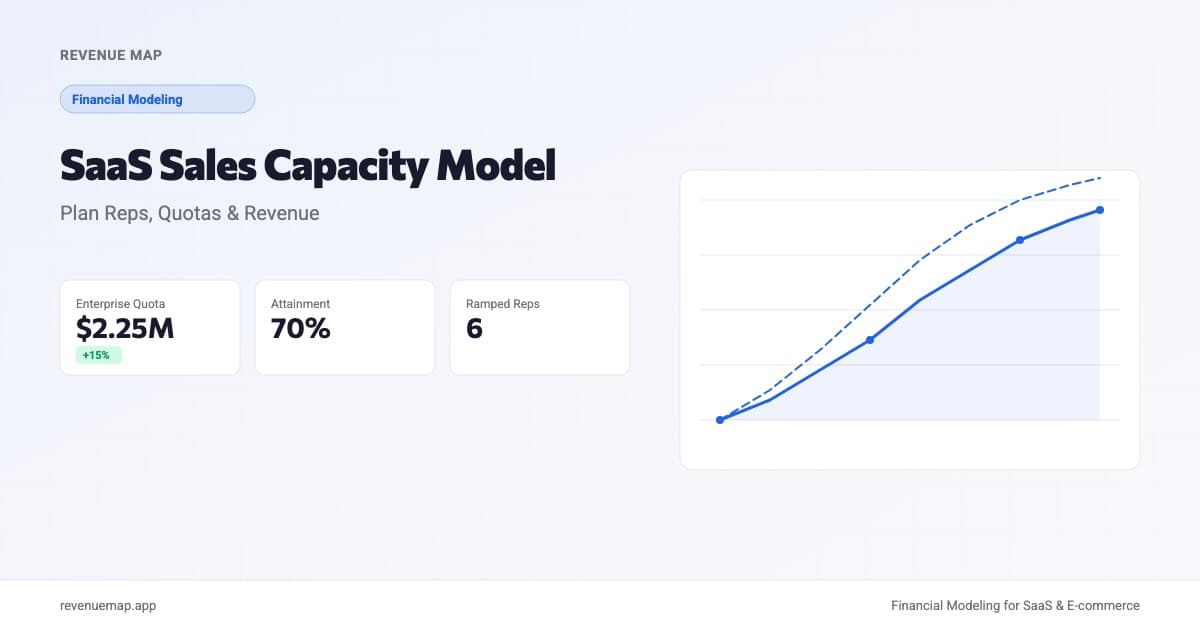
A SaaS sales capacity model forecasts how much revenue your sales team can produce based on headcount, quotas, ramp timelines, and attainment rates. It's the bridge between your hiring plan and your ARR target: without one, you're guessing how many reps you need or, worse, overhiring into a quota gap that takes months to close.
This matters right now because quota expectations are climbing. ICONIQ's 2026 GTM benchmark report (covering 150+ B2B companies) shows that top-quartile enterprise AEs carry $2.25M annual quotas, mid-market reps carry $1.35M, and SMB reps carry $750K. Those numbers are up 10-15% from two years ago. If your model still uses 2023 assumptions, your headcount plan may be off by two or three hires in either direction.
What Is a Sales Capacity Model?
A sales capacity model is a bottoms-up revenue forecast that starts with individual reps rather than top-line growth rates. Instead of saying "we'll grow 80% next year," you say "we have 8 ramped reps carrying $1.2M each at 65% attainment, plus 4 new hires ramping over Q1, which gives us $X in bookings capacity."
The power of this approach is specificity. It forces you to confront real constraints: how fast can you hire, how long does ramp take, what does attainment actually look like versus what you wish it looked like. For founders building a SaaS financial model, the capacity model becomes the engine underneath your revenue projections rather than a hand-wavy growth assumption.
Why Sales Capacity Planning Matters for Startups
Three reasons this deserves its own model rather than a back-of-napkin estimate:
Hiring lead time is long. A rep hired today won't produce full-capacity revenue for 4 to 6 months. If your board plan says "double ARR this year" and you start hiring in Q2, you've already missed the window. The capacity model makes this timing constraint visible.
Overhiring destroys burn. Each rep costs $150K-$250K fully loaded (base plus benefits plus tools plus management overhead) before they produce a dollar of bookings. Hiring three reps you don't need burns $600K+ before you can course-correct. The capacity model shows you the minimum headcount needed for your target.
Quota-to-OTE ratio drives comp planning. The industry standard is 5:1 for enterprise (quota = 5x OTE) and 4:1 for SMB. If you set quotas too low relative to OTE, your CAC balloons. Too high and you churn reps. The model keeps these ratios in check.
How to Build a Sales Capacity Model
Step 1: Segment Your Sales Team
Split reps by segment because quota, ramp, and attainment vary dramatically:
| Segment | 2026 Top-Quartile Quota | Avg Ramp Time | Typical Attainment |
|---|---|---|---|
| SMB | $750K | 3 months | 70-80% |
| Mid-Market | $1.35M | 4-5 months | 60-75% |
| Enterprise | $2.25M | 5-6 months | 55-70% |
These benchmarks come from ICONIQ's 2026 survey of GTM executives at 150+ B2B companies. Your numbers will differ based on ACV, sales cycle length, and market maturity. Use these as calibration points, not gospel.
Step 2: Define Ramp Curves
New hires don't produce at full capacity from day one. Model a ramp curve that accounts for onboarding, territory building, and pipeline creation:
Month 1: 0% of quota (onboarding, shadowing)
Month 2: 25% of quota (first pipeline, assisted deals)
Month 3: 50% of quota (independent prospecting)
Month 4: 75% of quota (maturing pipeline)
Month 5+: 100% of quota (fully ramped)
For a mid-market rep with a $1.35M annual quota ($112.5K/month), their first-quarter contribution is roughly $112.5K * (0 + 0.25 + 0.50) / 3 = $28K/month average, not the $112.5K a fully ramped rep produces.
Step 3: Apply Attainment Rates
Here's the honest part most founders skip: not every rep hits quota. Across your team, plan for a distribution:
- Top 20% of reps: 110-130% attainment
- Middle 50%: 60-90% attainment
- Bottom 30%: 30-50% attainment (some will churn out)
The blended average for a healthy team lands at 65-75% quota attainment. Using 100% in your model is fiction. Using 65% is planning.
Step 4: Calculate Total Capacity
The core formula:
Annual Revenue Capacity = Ramped Reps × Annual Quota × Attainment Rate
For a concrete example: 6 fully ramped mid-market AEs, each carrying $1.35M quotas at 70% attainment:
6 reps × $1.35M × 0.70 = $5.67M annual capacity
Add ramping reps at their discounted contribution:
3 new hires × $1.35M × 0.35 (avg ramp factor for year) × 0.70 = $992K
Total team capacity: $6.66M in bookings for the year.
Step 5: Work Backward from Your Target
Most founders know their ARR target before they know their headcount. Flip the formula:
Required Ramped Reps = Target New ARR / (Annual Quota × Attainment Rate)
If your target is $10M in new ARR from mid-market and you assume $1.35M quotas at 70% attainment:
$10M / ($1.35M × 0.70) = 10.6 → 11 fully ramped reps needed
Since new hires take 4-5 months to ramp, you need to hire early. If you need 11 ramped reps producing by Q4, you should have started those hires in Q1 or Q2.
Calculate Your Sales Capacity
Sales Capacity Calculator
Estimate annual revenue capacity from your sales team
Want to model this over 36 months with scenarios? Try Revenue Map free →
Connecting Capacity to Your Financial Model
The capacity model feeds directly into three other parts of your financial model:
Revenue forecast. Replace or validate your top-down growth assumption with the bottoms-up capacity number. If your capacity model says you can produce $6.6M but your board plan assumes $10M, something has to give: either more hiring (with lead time) or higher quotas (with attainment risk).
Headcount cost. Each rep carries a fully loaded cost. For mid-market AEs in 2026, budget $180K-$220K per rep (base $90-110K, variable $90-110K at full attainment, plus benefits, tools, and T&E). Multiply by planned headcount to get your GTM spend line.
Efficiency metrics. The Magic Number measures sales efficiency: net new ARR divided by prior-quarter sales and marketing spend. A healthy SaaS company targets 0.75 or above. Your capacity model should produce a Magic Number in that range. If it doesn't, your quotas are too low or your cost structure is too heavy.
2026 Quota Benchmarks in Context
The ICONIQ data is useful, but context matters. Here's how to interpret the numbers:
| Benchmark | What It Tells You | Watch Out For |
|---|---|---|
| $750K SMB quota | High-velocity, high-volume expected | Requires 80+ opportunities per rep per quarter |
| $1.35M Mid-Market quota | Balance of deal size and velocity | Assumes $30-50K ACV with 60-90 day cycles |
| $2.25M Enterprise quota | Large deals, fewer of them | Assumes $150K+ ACV, long sales cycles |
The SaaStr analysis notes that these 2026 quotas look similar to pre-AI era levels, just "ramped up." That's consistent with what we've seen: AI tools compress prospecting time (reps can source and qualify faster), which lets companies increase quota expectations without proportionally increasing cycle time.
That said, if you're an early-stage startup without a repeatable sales motion, don't anchor to top-quartile numbers. Start with your actual data: average deal size times reasonable velocity equals an achievable quota. Use the ICONIQ benchmarks as a north star, not a starting line.
Common Mistakes in Sales Capacity Planning
-
Using 100% attainment. No team hits 100% blended quota attainment. Even high-performing teams land at 70-80%. Model conservatively and celebrate the upside.
-
Ignoring ramp time. A rep hired January 1 isn't producing at capacity until May or June. If you model them as "productive in Q1," your forecast will miss by 30-40%.
-
Forgetting attrition. Average rep tenure at a startup is 18-24 months. If you have 10 reps, assume 2-3 will leave this year and need replacing. Each replacement triggers another ramp cycle.
-
Setting quotas without data. Quotas should derive from actual ACV and sales cycle data, not aspirational targets. A $1.35M quota means nothing if your ACV is $15K and reps can't close 90 deals per year.
-
Confusing bookings with revenue. The capacity model produces bookings (new annual contract value). Revenue recognition, especially with annual contracts, ramps over 12 months. Your MRR forecast needs to account for the difference.
Key Takeaways
- A sales capacity model connects headcount to revenue by modeling reps, quotas, ramp, and attainment, removing guesswork from your hiring plan.
- In 2026, ICONIQ benchmarks show top-quartile quotas of $750K (SMB), $1.35M (mid-market), and $2.25M (enterprise). Calibrate to your own ACV and cycle data.
- Plan for 65-75% blended attainment and 4-5 month ramp times. Using more optimistic assumptions will leave you short on revenue or overspent on headcount.
- Work backward from your ARR target to determine required headcount, then add lead time for hiring and ramp to get your start dates.
- Build this model as part of your broader SaaS financial plan so revenue, cost, and efficiency metrics stay internally consistent.
Revenue planning without a capacity model is just hope dressed up in a spreadsheet. The companies that hit their numbers are the ones that model the machine: how many reps, carrying what quota, producing at what rate. Build your model in Revenue Map and connect your headcount plan directly to your forecast.
Related Articles
SaaS Revenue Model Template for Startups
Build a SaaS revenue model from scratch with MRR components, pricing tier math, and expansion revenue. Includes a free calculator and benchmarks.
B2B SaaS Financial Model: Templates and Benchmarks
Build a B2B SaaS financial model with enterprise sales cycles, annual contracts, and expansion revenue. Includes 2026 benchmarks and a free ARR calculator.
Revenue Forecast Template for Startups (2026)
Build a revenue forecast from scratch. Grab our template with MRR growth formulas, churn adjustments, and expansion revenue built in.