Financial Model Examples: 5 Real Startup Models
Financial model examples show how real startups project revenue, costs, and cash flow. A SaaS model tracks MRR and churn, an e-commerce model tracks AOV and fulfillment costs, and a marketplace model tracks take rate and GMV. The structure depends on your business model, but every startup financial model needs an assumptions tab, a revenue build, a cost structure, and a cash flow forecast.
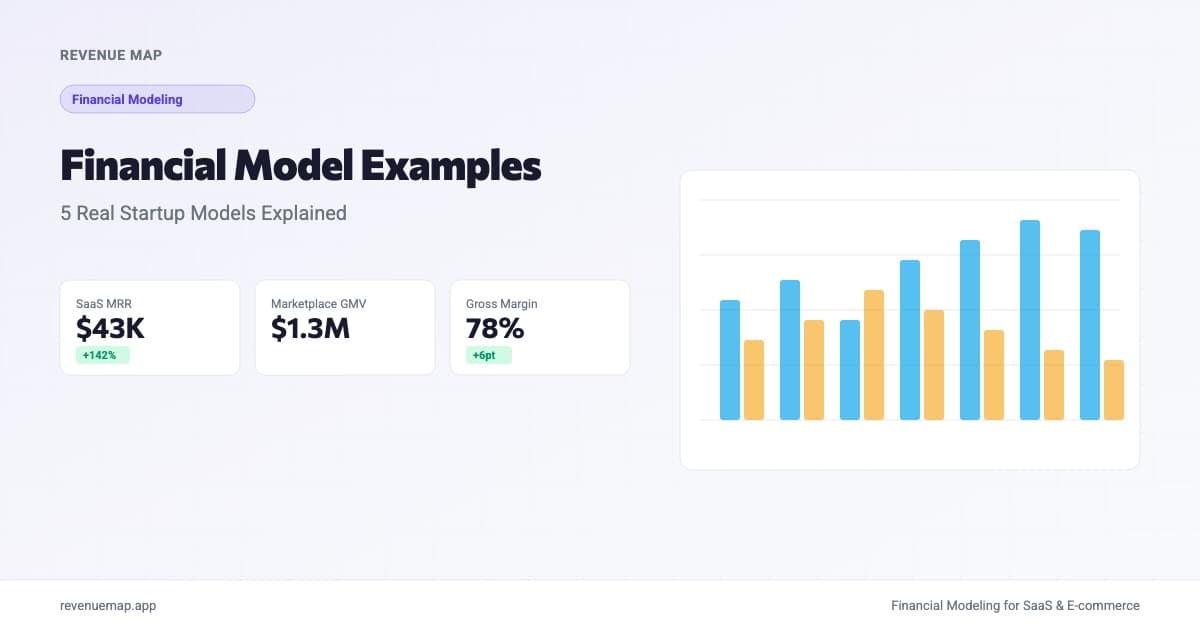
Financial model examples are worked-through projections that show how real startups forecast revenue, costs, and cash flow for a specific business type. The best way to build your own model is to study one that matches your revenue engine, then adapt the assumptions and formulas to your numbers.
This matters more than founders tend to think. Airtable, which recently sold for $2.25B at roughly 2.7x ARR after once being valued at $11.7B, had strong fundamentals: approximately $480M in annual recurring revenue, around 90% gross margins, and over 20% year-over-year growth. Those are the exact metrics a good financial model tracks. Whether you end up at a $2B exit or a $12B one depends on assumptions you can model today. Here are five concrete examples by business type.
What Makes a Financial Model Example Useful?
A useful financial model example is one you can reverse-engineer. It should show three things clearly: the input assumptions (growth rate, pricing, churn, costs), the formulas connecting them, and the outputs they produce (revenue, profit, cash balance). If you can swap in your own numbers and get a meaningful result, the example is working.
Every startup financial model, regardless of type, shares the same five-tab structure: assumptions, revenue, costs, P&L, and cash flow. The differences are in what drives the revenue tab. For a deeper walkthrough of this structure, see the financial model template guide.
Example 1: SaaS Financial Model
A SaaS financial model is built around monthly recurring revenue. The revenue engine is subscription-based: customers pay monthly or annually, and revenue compounds as long as retention holds.
Here's what a SaaS model looks like using realistic early-stage numbers.
Key assumptions:
- Starting customers: 200
- New customers per month: 25 (growing 5% month-over-month)
- Monthly churn rate: 4%
- ARPU: $89/month
- Gross margin: 80%
Revenue formula:
MRR = Active Customers x ARPU
Monthly Revenue = (Previous Customers + New Customers - Churned Customers) x ARPU
What the outputs look like at Month 12:
| Metric | Month 1 | Month 6 | Month 12 |
|---|---|---|---|
| Active Customers | 200 | 310 | 485 |
| MRR | $17,800 | $27,590 | $43,165 |
| ARR (annualized) | $213,600 | $331,080 | $517,980 |
| Gross Profit | $14,240 | $22,072 | $34,532 |
The critical metric most early-stage SaaS models miss is net revenue retention. If your existing customers expand (upgrade plans, add seats), NRR above 110% means your revenue grows even without acquiring a single new customer. Airtable's 20%+ growth at $480M ARR demonstrates what strong retention looks like at scale.
For a complete SaaS modeling walkthrough, see the SaaS financial modeling guide.
Example 2: E-Commerce Financial Model
An e-commerce financial model replaces MRR with transaction volume. Revenue is a function of orders, not subscriptions. The economics are fundamentally different: margins are lower, but the addressable market is often larger.
Key assumptions:
- Monthly site visitors: 50,000
- Conversion rate: 2.5%
- Average order value (AOV): $65
- COGS (product + shipping): 45% of revenue
- Return rate: 8%
- Customer acquisition cost: $28
Revenue formula:
Monthly Revenue = Visitors x Conversion Rate x AOV x (1 - Return Rate)
Gross Profit = Revenue - (Revenue x COGS%)
What the outputs look like:
| Metric | Month 1 | Month 6 | Month 12 |
|---|---|---|---|
| Orders | 1,250 | 1,680 | 2,400 |
| Revenue | $74,750 | $100,464 | $143,520 |
| Gross Profit | $41,113 | $55,255 | $78,936 |
| CAC Payback | 1.7 orders | 1.5 orders | 1.3 orders |
The biggest modeling trap in e-commerce is ignoring the gap between revenue recognition and cash collection. If you hold inventory, your cash flow model needs to account for the weeks or months between paying your supplier and receiving customer payment. That timing mismatch has killed more e-commerce startups than low margins ever did. For deeper coverage, see the e-commerce unit economics guide.
Example 3: Marketplace Financial Model
A marketplace model is unique because you model two sides: supply (sellers) and demand (buyers). Revenue comes from a take rate on transactions, not from selling products or subscriptions directly.
Key assumptions:
- Active sellers: 150
- Average listings per seller: 8
- Monthly transactions per listing: 3
- Average transaction value: $120
- Take rate: 12%
- Seller acquisition cost: $45
- Buyer acquisition cost: $18
Revenue formula:
GMV = Active Sellers x Listings per Seller x Transactions per Listing x Avg Transaction Value
Revenue = GMV x Take Rate
What the outputs look like:
| Metric | Month 1 | Month 6 | Month 12 |
|---|---|---|---|
| GMV | $432,000 | $720,000 | $1,296,000 |
| Net Revenue | $51,840 | $86,400 | $155,520 |
| Gross Margin | 72% | 75% | 78% |
Marketplace models have a cold-start problem that shows up directly in the financials. Until you hit liquidity (enough sellers to attract buyers and vice versa), your unit economics look terrible. Most marketplace financial models build in a "subsidy phase" during months 1 through 6 where CAC is intentionally high and take rate may be lower to drive adoption.
Example 4: Agency and Services Financial Model
An agency model is capacity-constrained. Revenue is capped by the number of billable people you employ and the hours they can work. This makes it simpler to model than SaaS or marketplace, but harder to scale.
Key assumptions:
- Billable staff: 8
- Average hourly rate: $150
- Utilization rate: 70%
- Monthly working hours per person: 160
- Fully loaded cost per employee: $8,500/month
Revenue formula:
Monthly Revenue = Billable Staff x Hours per Month x Utilization Rate x Hourly Rate
Monthly Cost = Billable Staff x Fully Loaded Cost + Overhead
What the outputs look like:
| Metric | Value |
|---|---|
| Monthly Revenue | $134,400 |
| Staff Cost | $68,000 |
| Overhead (rent, tools, admin) | $22,000 |
| Monthly Net Profit | $44,400 |
| Net Margin | 33% |
The lever in an agency financial model is utilization rate, not customer acquisition. Raising utilization from 70% to 80% on an 8-person team adds $19,200/month in revenue with zero additional cost. That single input swing is worth more than most marketing campaigns.
Example 5: Mobile App Financial Model
A mobile app model typically runs on freemium economics: large user bases with low conversion rates. Revenue comes from premium upgrades, in-app purchases, or advertising.
Key assumptions:
- Monthly downloads: 15,000
- Day-30 retention: 20%
- Free-to-paid conversion: 3%
- Monthly subscription price: $9.99
- Ad revenue per free DAU: $0.04/day
- App store commission: 30%
Revenue formula:
Subscription Revenue = DAU x Conversion Rate x Monthly Price x (1 - Store Commission)
Ad Revenue = Free DAU x Ad RPM x 30
Total Revenue = Subscription Revenue + Ad Revenue
The dynamics of a mobile app financial model are unusual because your largest cost (user acquisition) front-loads while revenue trickles in over months. Model the LTV-to-CAC ratio carefully: if payback takes longer than six months, you need either a lower CAC channel or a higher conversion rate.
Calculate Your Startup Revenue Projection
Revenue Projection Calculator
Estimate monthly revenue from your core unit economics
Want to model this over 36 months with scenarios? Try Revenue Map free →
How to Pick the Right Model Type
| If your startup... | Use this model | Primary revenue driver | Key metric to watch |
|---|---|---|---|
| Charges monthly/annual subscriptions | SaaS | MRR, ARR | Net revenue retention |
| Sells physical or digital products | E-Commerce | Order volume x AOV | CAC payback period |
| Connects buyers and sellers | Marketplace | GMV x take rate | Liquidity ratio |
| Sells hours, projects, or retainers | Agency/Services | Headcount x utilization x rate | Utilization rate |
| Free app with premium tier or ads | Mobile App / Freemium | DAU x conversion x price | LTV/CAC ratio |
The honest answer: most startups map clearly to one of these five types. If you're a hybrid (say, a SaaS product with a marketplace component), pick the model type that drives the majority of your revenue and add a secondary revenue line for the rest. Don't try to build a custom model from scratch. Start with the proven structure and adapt.
Patterns That Show Up in Every Model
After looking across all five model types, a few things stand out.
First, the assumptions tab matters more than anything else. It's the single place where your model either reflects reality or drifts into fiction. Every variable that can change, pricing, growth rate, churn, cost per unit, needs to live in one place. When an investor asks what happens if growth slows by half, you should be able to answer in ten seconds.
Second, burn rate and runway are universal. Whether you're running a SaaS company or an agency, the cash flow tab tells you when you run out of money. That number matters more than any revenue projection. Model it monthly, update it with actuals, and never let it surprise you.
Third, every model breaks past 24 months. Compounding assumption error makes projections beyond two years directionally interesting at best. Forecast 12 months for operations, 18 to 24 months for fundraising, and treat anything beyond that as scenario planning.
Key Takeaways
- Every startup financial model has the same five-tab structure (assumptions, revenue, costs, P&L, cash flow), but the revenue formulas differ by business type.
- SaaS models track MRR and churn. E-commerce models track AOV and order volume. Marketplace models track GMV and take rate. Agency models track utilization. App models track DAU and conversion.
- Real company data makes better examples than hypothetical numbers. Airtable's $480M ARR at 90% gross margins shows what a mature SaaS model looks like at scale.
- The assumptions tab is the most valuable part of any financial model. If your inputs are realistic, the outputs take care of themselves.
- Start with the model type closest to your revenue engine, then customize from there. A proven structure adapted to your business beats a custom build every time.
Want to skip the spreadsheet setup? Build your financial model with Revenue Map. Pick your business type, plug in your assumptions, and get a working model in minutes.
Related Articles
SaaS Revenue Model Template for Startups
Build a SaaS revenue model from scratch with MRR components, pricing tier math, and expansion revenue. Includes a free calculator and benchmarks.
B2B SaaS Financial Model: Templates and Benchmarks
Build a B2B SaaS financial model with enterprise sales cycles, annual contracts, and expansion revenue. Includes 2026 benchmarks and a free ARR calculator.
Revenue Forecast Template for Startups (2026)
Build a revenue forecast from scratch. Grab our template with MRR growth formulas, churn adjustments, and expansion revenue built in.