B2B SaaS Financial Model: Templates and Benchmarks
A B2B SaaS financial model projects revenue, costs, and cash flow for a business selling subscriptions to other companies. It differs from consumer SaaS models by incorporating longer sales cycles, annual contracts, seat-based expansion, and net revenue retention as the primary growth engine.
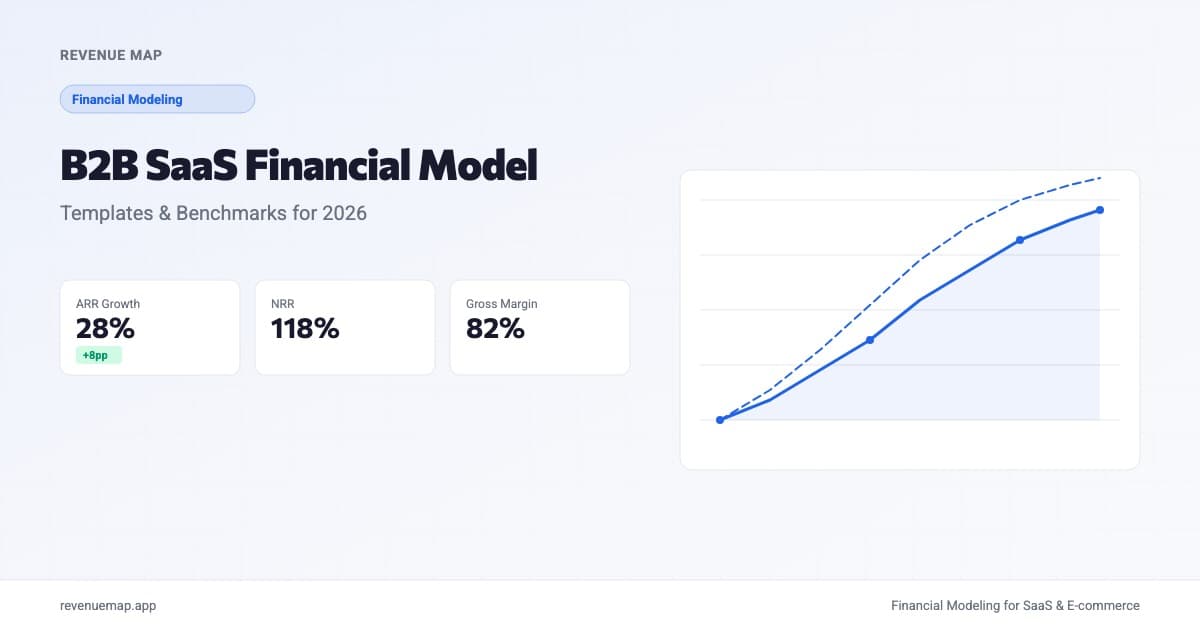
A B2B SaaS financial model projects how a subscription business selling to other companies will generate revenue, incur costs, and consume cash over time. It is structurally different from a consumer or PLG SaaS model because B2B revenue is driven by a sales team working enterprise deals, not a self-serve funnel processing credit cards. If your model doesn't account for sales capacity, annual contracts, and expansion revenue separately, it is going to mislead you on both timing and magnitude.
This distinction matters more than ever. Atlassian just reported $6.6 billion in ARR with 28% year-over-year growth, and its remaining performance obligations (committed future revenue) grew 44%. The bear case that AI would commoditize enterprise tools hasn't played out. What Atlassian's numbers actually show is that B2B SaaS with strong expansion economics compounds in ways that self-serve models rarely replicate.
What Makes B2B SaaS Financial Modeling Different?
A B2B SaaS financial model is a revenue, cost, and cash projection built around enterprise sales mechanics: quota-carrying reps, multi-month deal cycles, annual contracts, and seat-based expansion.
Consumer SaaS models project revenue from a conversion funnel: visitors become trials, trials become paid subscribers, paid subscribers churn at a monthly rate. The math is clean because each customer decision is fast, independent, and small.
B2B breaks every one of those assumptions. A single enterprise deal can take 3 to 9 months to close, involve multiple stakeholders, and land at an annual contract value (ACV) of $25,000 to $250,000 or more. Revenue timing depends not on when a user clicks "upgrade" but on when a procurement team signs a contract. That creates modeling challenges that a standard SaaS financial model template simply doesn't handle.
Here are the five structural differences you need to account for:
| Dimension | PLG / SMB SaaS | B2B Enterprise SaaS |
|---|---|---|
| Revenue driver | Self-serve funnel | Sales team capacity |
| Billing | Monthly | Annual or multi-year |
| Average deal size | $10-$100/mo | $25K-$250K+ ACV |
| Sales cycle | Same day to 2 weeks | 3-9 months |
| Growth engine | New signups | Net revenue retention |
How to Build a B2B SaaS Revenue Model
Build B2B SaaS revenue bottom-up from sales capacity, not from a conversion funnel or a percentage of TAM.
The formula is straightforward:
New ARR = Quota-Carrying Reps x Average Quota x Attainment Rate
Say you have 8 quota-carrying reps, each with a $600K annual quota, and your team averages 75% attainment. That gives you:
New ARR = 8 x $600,000 x 0.75 = $3,600,000
That $3.6M is your new business ARR for the year. But in a B2B model, new logos are only part of the story. Expansion revenue from existing customers often contributes 30-50% of total ARR growth at scale. This is where net revenue retention becomes the most important number in your model.
Modeling Expansion Revenue with NRR
Net revenue retention measures how much revenue your existing customer base generates compared to the same period last year, including upgrades, downgrades, and churn.
Expansion ARR = Beginning ARR x (NRR - 100%)
If you start the year with $8M in ARR and your NRR is 115%, your existing customers will generate $1.2M in net expansion:
Expansion ARR = $8,000,000 x 0.15 = $1,200,000
Combined with $3.6M in new ARR, your total ending ARR would be $12.8M. That 60% growth rate comes from a combination of sales capacity and retention economics, not from a single viral coefficient.
For context, Atlassian's 28% growth at $6.6B in annual revenue is driven primarily by expansion. At that scale, no sales team can add enough new logos to move the needle alone. NRR is the compounding engine.
Modeling the Sales Pipeline
B2B deals don't close instantly. A three-month average sales cycle means the deals your reps source in Q1 close in Q2. Your model needs a pipeline stage conversion funnel:
| Stage | Conversion Rate | Average Days |
|---|---|---|
| Qualified Lead | 100% (entry) | 0 |
| Discovery | 60% | 14 |
| Proposal | 45% | 30 |
| Negotiation | 70% | 21 |
| Closed Won | 80% | 14 |
| Cumulative Win Rate | ~15% | ~80 days |
This pipeline model creates a revenue lag that you need to capture. If you hire 4 new reps in January, their pipeline takes 2-3 months to build and another 3 months to convert. You won't see meaningful revenue contribution until Q3 or Q4. Models that project immediate revenue from new sales hires are the single most common mistake in B2B SaaS forecasting.
For a deeper breakdown of sales-capacity planning, see our SaaS sales capacity model guide.
The B2B Cost Structure
B2B SaaS cost models differ from self-serve models in two important ways: sales compensation is the largest operating expense, and professional services can be a meaningful (if lower-margin) revenue stream.
Sales Compensation Modeling
Total Sales Cost = (Base Salary + Variable Comp at Quota) x Reps + Sales Management + SDRs
A typical B2B SaaS sales team structure at Series A or B:
- Account Executives: $120K base + $120K variable (at 100% quota attainment)
- SDRs: $60K base + $30K variable
- Sales Management: 1 VP or Director per 6-8 AEs
Your model should vary variable compensation with actual attainment, not assume everyone hits quota. If your plan has 10 reps at $240K OTE and your average attainment is 75%, your actual sales cost is closer to $2.1M than $2.4M.
Gross Margin Benchmarks
B2B SaaS gross margins should land between 75% and 85%. If you include professional services (implementation, onboarding, training), model them as a separate line item because services margins typically run 15-30%, well below software margins. Blending the two hides the real economics of your core product.
| Revenue Type | Target Margin | Notes |
|---|---|---|
| Software subscriptions | 78-85% | Core SaaS margin |
| Professional services | 15-30% | Implementation, training |
| Blended (if applicable) | 70-80% | Weight by revenue mix |
Calculate Your B2B SaaS ARR
B2B SaaS ARR Calculator
Project annual recurring revenue from sales capacity and expansion
Want to model this over 36 months with scenarios? Try Revenue Map free →
B2B SaaS Benchmarks by Stage
Benchmarks shift as B2B companies scale. What works at $1M ARR breaks at $20M.
| Metric | Seed to $1M ARR | Series A ($1-5M) | Series B+ ($5M+) |
|---|---|---|---|
| NRR | 95-105% | 105-115% | 115%+ |
| Gross Margin | 70-78% | 75-82% | 78-85% |
| Sales Cycle | 30-60 days | 45-90 days | 60-180 days |
| CAC Payback | 18-24 months | 15-18 months | 12-15 months |
| Magic Number | 0.5-0.75 | 0.75-1.0 | 0.75-1.2 |
| Rule of 40 | 40%+ (mostly growth) | 40%+ (balanced) | 40%+ (margin rising) |
At the extreme end, Atlassian's numbers show what elite B2B SaaS economics look like at scale: 28% growth plus strong margins comfortably clearing the Rule of 40 threshold, with RPO growth of 44% indicating that committed future revenue is accelerating even faster than recognized revenue.
Cash Flow: Why Annual Contracts Change Everything
B2B SaaS companies that sell annual contracts collect cash upfront but recognize revenue monthly. This creates a working capital advantage that monthly-billing SaaS companies don't have.
Deferred Revenue = Annual Contract Value - Revenue Recognized to Date
If you close a $120K annual contract on January 1, you collect $120K in cash immediately but recognize only $10K per month as revenue. By March 31, you've recognized $30K in revenue and still have $90K in deferred revenue on your balance sheet.
This matters for your financial model because:
- Cash runway is longer than burn rate suggests. Your monthly burn might be $200K, but if you're collecting annual contracts, your actual cash position improves faster than your P&L shows.
- RPO (remaining performance obligations) signals forward revenue. This is the metric Atlassian highlighted at 44% growth. It measures contractually committed but not yet invoiced or recognized revenue. A growing RPO means your future revenue is locked in.
- Churn timing differs. A customer who decides to leave in month 4 of an annual contract still pays through month 12. Your revenue churn and cash churn happen on different timelines.
Model these cash timing differences explicitly. A B2B SaaS company with $5M ARR on annual contracts and $3M in deferred revenue has a very different cash position than one with $5M ARR on monthly billing.
Common B2B SaaS Modeling Mistakes
1. Projecting revenue from new reps immediately. New account executives take 3-6 months to ramp. Month 1 is learning the product. Months 2-3 are building pipeline. Months 4-6 are closing first deals. Your model should include a ramp period where new reps contribute zero or partial quota.
2. Ignoring the expansion wedge. First-time founders often model B2B SaaS as "new logos times ACV" without accounting for expansion. In mature B2B companies, expansion from existing customers can equal or exceed new business ARR. If your model doesn't have a separate expansion line driven by NRR, it's materially understating future revenue.
3. Using monthly churn rates for enterprise. Logo churn in B2B enterprise SaaS is often measured annually because contracts are annual. Converting a 15% annual logo churn to monthly (about 1.35%) and plugging it into a monthly model overstates the churn impact in months where no contracts are actually up for renewal. Model churn by cohort and renewal date instead.
4. Blending software and services margins. A company with $8M in software revenue at 82% margin and $2M in services revenue at 20% margin has a blended margin of 69.6%. That's below the 75% threshold investors look for in SaaS. But the core product is healthy. Reporting a blended number without the breakout misleads investors and yourself.
5. Modeling average deal size as static. B2B ACV tends to rise over time as the sales team moves upmarket, adds more product lines, or improves pricing. Model ACV growth separately. Even a 5-10% annual increase in ACV compounds significantly over a three-year forecast.
Key Takeaways
- Build revenue bottom-up from sales capacity: reps times quota times attainment, plus expansion from existing customers driven by NRR
- NRR is the most important metric in a B2B SaaS model because it determines whether your install base compounds or erodes; target 110% or higher
- Account for sales ramp time: new reps take 3-6 months to contribute meaningful revenue; models that assume instant productivity overstate near-term growth
- Annual contracts create a cash flow advantage by collecting upfront while recognizing monthly; model deferred revenue and cash separately from recognized revenue
- Track RPO alongside ARR to understand committed future revenue, just as Atlassian does at $6.6B in annual revenue with 44% RPO growth
- Never blend software and services margins in a single line; investors want to see the core SaaS margin above 75%
Building a B2B SaaS financial model that captures these dynamics takes more structure than a basic SaaS template. Revenue Map's SaaS financial model handles sales capacity planning, NRR-driven expansion, and scenario branching in one place. Start building yours now.
Related Articles
SaaS Revenue Model Template for Startups
Build a SaaS revenue model from scratch with MRR components, pricing tier math, and expansion revenue. Includes a free calculator and benchmarks.
Revenue Forecast Template for Startups (2026)
Build a revenue forecast from scratch. Grab our template with MRR growth formulas, churn adjustments, and expansion revenue built in.
Financial Model Examples: 5 Real Startup Models
See real financial model examples for SaaS, e-commerce, marketplace, agency, and mobile app startups. Includes formulas, benchmarks, and a free calculator.