Startup Financial Model Template (2026 Guide)
A startup financial model template is a structured spreadsheet that projects your revenue, expenses, and cash position over 12 to 24 months. It connects your assumptions about pricing, growth, and costs to outputs like burn rate, runway, and unit economics that investors use to evaluate your business.
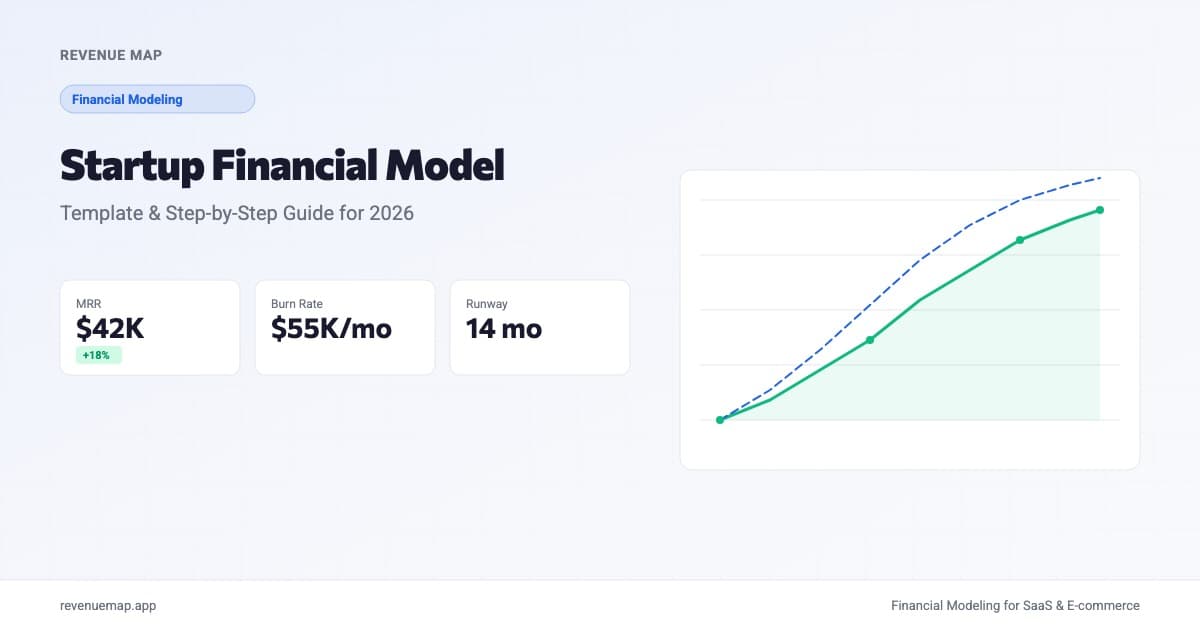
A startup financial model template gives you the structure to connect your assumptions about growth, pricing, and costs to the outputs that actually matter: burn rate, runway, and unit economics. Unlike a generic spreadsheet, a startup-specific template accounts for the realities of early-stage companies, including pre-revenue periods, lumpy customer acquisition, and the need to model multiple fundraising scenarios. If you have been putting off building a model because the blank spreadsheet felt overwhelming, this guide walks you through what to include, what to skip, and how to keep the whole thing useful beyond week one.
Why build one now? Consider the range of what "startup financial modeling" looks like in 2026. On one end, General Catalyst just led a $1.1 billion round into River AI, a company that was two months old at the time. On the other, most seed-stage founders are modeling their way to a $500K raise with 18 months of runway. The financial model serves both. It is the document that translates your business thesis into numbers an investor (or your own team) can stress-test.
What Is a Startup Financial Model?
A startup financial model is a dynamic spreadsheet that projects revenue, expenses, and cash flow over 12 to 24 months based on a set of input assumptions. The word "dynamic" is doing real work here. A static table of projected revenue is a forecast. A model lets you change an input, say your monthly churn rate or your average deal size, and watch every downstream number update automatically.
Every useful startup financial model has five layers:
- Revenue model: how money comes in, built from unit economics (customers x price), not top-down guesses
- Cost model: fixed costs (rent, salaries, tools) plus variable costs that scale with revenue or headcount
- Cash flow model: when cash actually enters and leaves your bank account, which is often different from when revenue is "earned"
- Unit economics dashboard: CAC, LTV, gross margin, and payback period
- Scenario engine: base, conservative, and aggressive cases running simultaneously
If you have already built a SaaS financial model, this structure will look familiar. The difference is that a startup-specific template handles pre-revenue periods, variable growth rates, and fundraising milestones that a mature-company model skips.
Why Most Startup Models Break (and How to Avoid It)
The most common failure is building top-down. A founder writes "$2M ARR by month 18" in a cell, then reverse-engineers inputs to make the number work. The model looks clean. It is also fiction.
Build bottom-up instead. Start with how many customers you can realistically acquire per month given your current channels, what they will pay, and how long they will stay. The revenue number that falls out of those inputs is your actual projection. If it is not exciting enough, the answer is to improve the inputs (better conversion, higher pricing, lower churn), not to edit the output cell.
Here is what separates startup models that get used from ones that get abandoned:
| Trait | Models that work | Models that fail |
|---|---|---|
| Revenue logic | Bottom-up from unit economics | Top-down ARR target |
| Update cadence | Monthly with actuals | Built once, never touched |
| Scenario count | 3 cases minimum | Single "base case" |
| Expense detail | Line-item by category | Lumped "operating costs" |
| Cash vs. revenue | Separate cash flow layer | Assumes revenue = cash |
How to Build Your Startup Financial Model: Step by Step
Step 1: Set Your Revenue Assumptions
Start with what you know or can defensibly estimate:
- Current customers (or zero, if pre-revenue)
- Average revenue per account (ARPA) per month
- New customers per month, based on your current acquisition channels
- Monthly churn rate, from your actual data or industry benchmarks
The monthly revenue formula:
MRR(month N) = MRR(month N-1) + New MRR - Churned MRR + Expansion MRR
For pre-revenue startups, set month 1 MRR to zero and model when your first paying customer arrives. Be honest about the timeline. Most B2B SaaS startups take 3 to 6 months from launch to first recurring revenue.
Step 2: Build the Expense Forecast
Split expenses into three buckets:
Fixed costs that do not change with revenue: office space, founder salaries, core SaaS tools, insurance. These are your baseline burn.
Semi-variable costs that step up with headcount milestones: hiring your first engineer, adding a sales rep, expanding server capacity. Model these as discrete events at specific months, not smooth curves.
Variable costs that scale directly with revenue or customer count: payment processing fees, customer support per ticket, hosting costs per user.
The honest answer is that most early-stage startups have 80% fixed costs. Your burn rate is largely your team. That changes as you scale, but at the seed stage, payroll dominates everything.
Step 3: Model Cash Flow Separately
Revenue recognition and cash collection are different things. A customer who signs an annual contract in March might pay net-30, meaning cash arrives in April. A customer on monthly billing pays as they go. Your P&L might show $50K in revenue while your bank account tells a different story.
Build a simple cash flow layer:
Cash(month N) = Cash(month N-1) + Cash Received - Cash Spent
This is where startup runway lives. Your runway is not revenue minus expenses. It is cash in the bank divided by net cash burn per month. If you want the full picture of how revenue, expenses, and cash connect, a three-statement financial model links all three.
Step 4: Add Unit Economics
Investors will ask about four numbers. Have them ready:
CAC = Total Sales & Marketing Spend / New Customers Acquired
LTV = ARPA / Monthly Churn Rate
LTV:CAC Ratio = LTV / CAC
CAC Payback = CAC / (ARPA x Gross Margin %)
A healthy SaaS business targets an LTV:CAC ratio above 3x and a CAC payback period under 18 months. To see what benchmarks look like at scale, SaaStr's recent analysis of Palo Alto Networks shows what happens when unit economics work: 120% net revenue retention and 60% ARR growth at $11.4 billion in revenue. Your numbers will be smaller, but the ratios are the same framework.
Step 5: Build Three Scenarios
Never ship a model with a single projection. Build three:
- Conservative: lower growth, higher churn, slower hiring. Use this for internal planning.
- Base: your best estimate of what actually happens. Update monthly against actuals.
- Aggressive: everything goes right. Use this to show investors the upside, but label it clearly.
The scenarios should share the same structure. Only the input assumptions change. If your conservative case still shows 12+ months of runway, you are in a solid position. If it shows 6 months, you need to start fundraising conversations now.
Calculate Your Startup Runway
Startup Runway Calculator
Estimate how many months your cash will last
Want to model this over 36 months with scenarios? Try Revenue Map free →
Startup Financial Model Benchmarks by Stage
| Metric | Pre-Seed | Seed | Series A |
|---|---|---|---|
| Monthly burn | $10K-30K | $30K-80K | $80K-200K |
| Runway target | 12-18 months | 18-24 months | 18-24 months |
| LTV:CAC ratio | Not yet measurable | 2x-3x | 3x-5x |
| CAC payback | Not yet measurable | Under 18 months | Under 12 months |
| Revenue growth (MoM) | Pre-revenue | 15-25% | 10-15% |
These benchmarks come with a caveat: they vary significantly by business model. A marketplace startup will have different unit economics than a vertical SaaS company. Use the ranges as sanity checks, not as targets to optimize toward in a vacuum.
Common Mistakes to Avoid
-
Modeling revenue without modeling costs to acquire it. If your model shows $100K MRR by month 12 but no corresponding increase in sales and marketing spend, the projection is disconnected from reality. Every dollar of new revenue has an acquisition cost.
-
Ignoring working capital. Enterprise customers pay net-60 or net-90. If you book $50K in revenue in March but do not collect until June, your cash model needs to reflect that delay. This is especially dangerous for startups selling annual contracts to large organizations.
-
Using smooth growth curves. Real startup growth is lumpy. You close a big deal in month 4, have a dry spell in month 5, then land three customers in month 6. Model the trend, but build enough cash buffer to survive the gaps.
-
Skipping the scenario analysis. A single-scenario model is a guess with formatting. If you cannot show an investor what happens when growth slows by 30% or churn doubles, you do not understand your own business well enough.
Key Takeaways
- Build your startup financial model bottom-up from unit economics, never top-down from a revenue target
- Include five layers: revenue, costs, cash flow, unit economics, and scenario analysis
- Update monthly with actuals and track the variance between projected and real numbers
- Model at least three scenarios so you can plan for the realistic range of outcomes, not just the optimistic one
- The model is a decision-making tool, not a fundraising artifact. If you stop opening it after your raise, it has already failed
The founders who model rigorously and update consistently make better decisions about hiring, spending, and fundraising timing. Start building your startup financial model with Revenue Map. It connects your assumptions to investor-ready projections in minutes, not weeks.
Related Articles
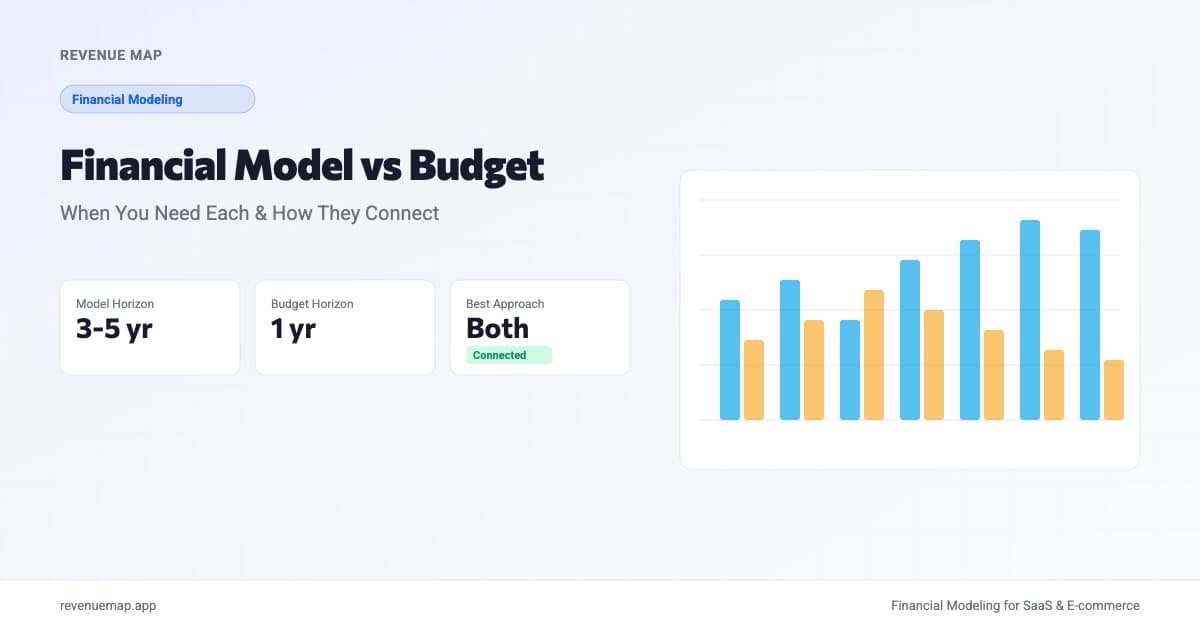
Financial Model vs Budget: When You Need Each
A financial model projects scenarios over 3-5 years. A budget allocates spending for 12 months. Here is when to use each and how to connect them.
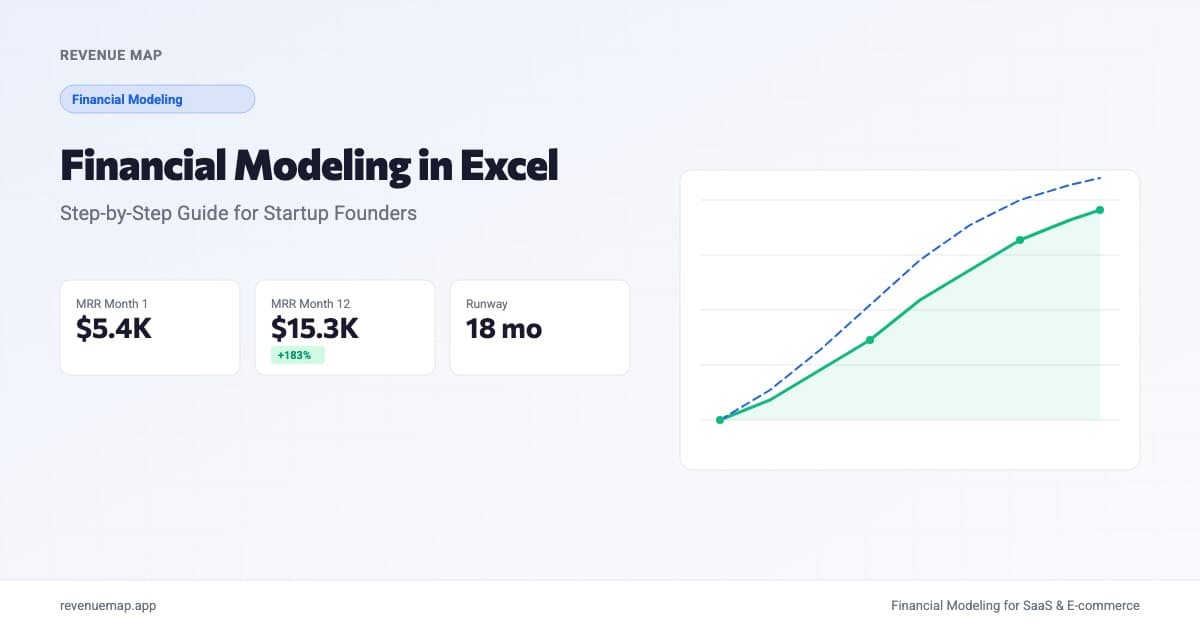
Creating Financial Models in Excel for Startups
Step-by-step guide to building a startup financial model in Excel. Covers revenue, expenses, cash flow, and scenario analysis with formulas and examples.
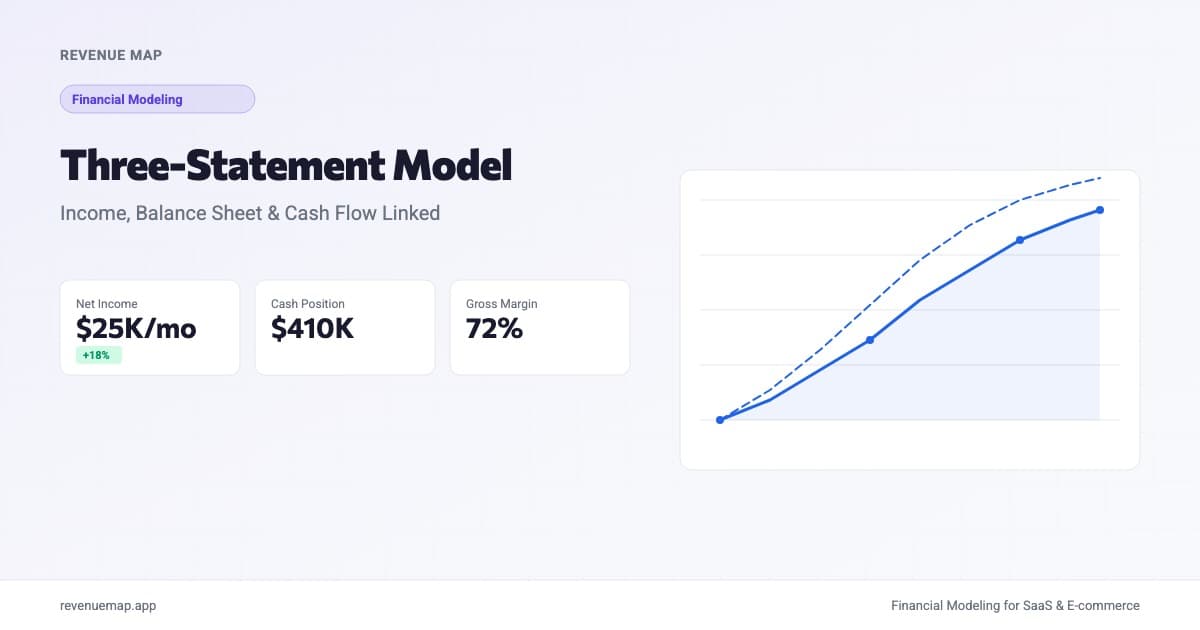
Three-Statement Financial Model Template
How to build a three-statement financial model that connects your income statement, balance sheet, and cash flow. Includes template, formulas, and startup examples.