Creating Financial Models in Excel for Startups
To create a financial model in Excel, start with three core tabs: assumptions, income statement, and cash flow. Enter your revenue drivers like customer count and average revenue per account, build monthly projections for 12 to 24 months, then layer in expenses and calculate runway.
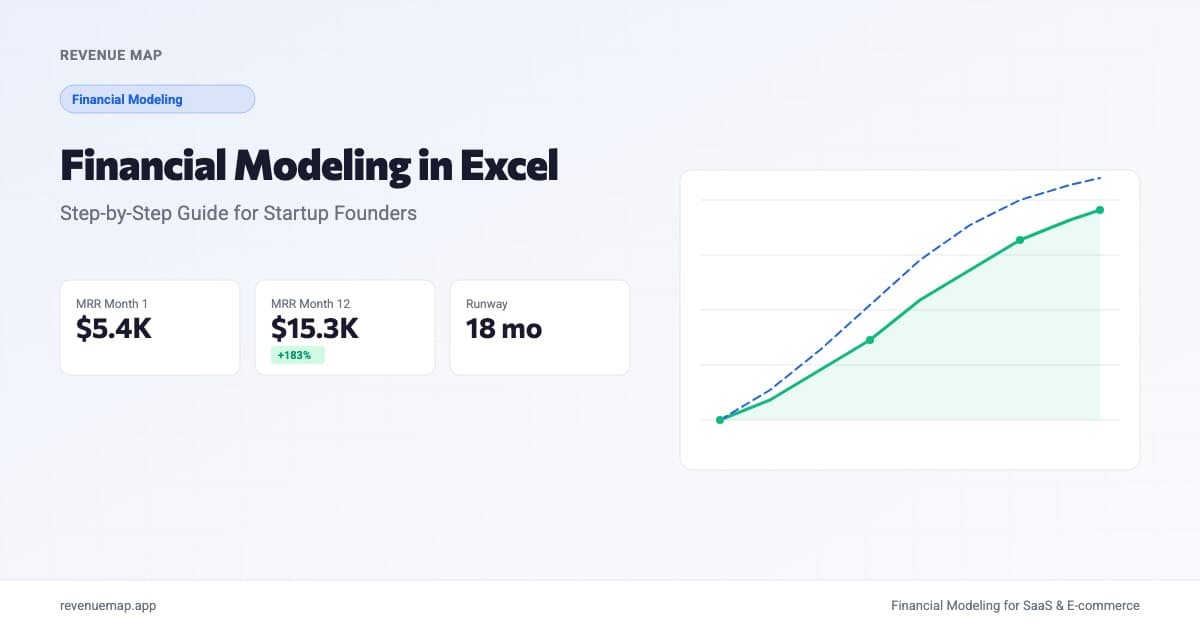
Creating a financial model in Excel means building a spreadsheet that connects your startup's key assumptions (growth rate, pricing, churn, costs) to projected outputs (revenue, expenses, cash flow, and runway). A well-built model lets you change one input and see the impact cascade through every projection. If your startup doesn't have one yet, or if yours is a static spreadsheet that nobody updates, this guide walks you through building one from scratch.
The timing matters. According to SaaStr's August 2026 analysis, Canva just cut its 2026 growth forecast by a third as AI serving costs reshaped its economics. That's a company worth tens of billions revising its model in real time. Meanwhile, Databricks raised $5B at a $190B valuation partly because AI infrastructure is so expensive that even profitable companies need capital cushions. If these companies are stress-testing their financial models constantly, early-stage founders should be doing the same.
What Is a Financial Model?
A financial model is a structured spreadsheet that translates your business assumptions into projected financial outcomes. It answers the question every founder, investor, and board member asks: "What happens to revenue, expenses, and cash if X changes?"
Unlike a static budget that you set once a year, a financial model is dynamic. Change the monthly churn rate from 5% to 7%, and the model instantly recalculates revenue, lifetime value, and runway. That responsiveness is what makes it useful for decisions, not just reporting.
For startups, a financial model typically covers 18 to 24 months of monthly projections plus 3 to 5 years of annual summaries. It lives in Excel (or Google Sheets) and usually contains four to six interconnected tabs. A simple model with correct formulas beats a beautiful one with hardcoded numbers.
How to Build a Financial Model in Excel: Step by Step
Step 1: Set Up the Assumptions Tab
This is the control panel for your entire model. Every number that might change should live here as a named input, not buried in a formula somewhere in row 247.
Create a tab called "Assumptions" and organize it into these sections:
Revenue drivers:
- Starting customer count (or subscribers)
- Monthly customer growth rate (%)
- Average revenue per account (ARPU) in dollars
- Monthly churn rate (%)
- Expansion revenue rate (% of existing MRR from upsells)
Expense drivers:
- Headcount by department (engineering, sales, G&A) with fully loaded cost per person
- Infrastructure cost per customer (hosting, API costs)
- Marketing spend as a percentage of revenue or as a fixed monthly amount
- One-time costs (legal, office setup, equipment)
Funding assumptions:
- Current cash balance
- Expected funding amount and close date
Use Excel's named ranges so your formulas read like =starting_customers * (1 + growth_rate) instead of =B4 * (1 + B7). This makes the model auditable and reduces errors.
Step 2: Build the Revenue Model
Create a "Revenue" tab with months as columns (Month 1, Month 2, ... Month 24) and revenue components as rows.
The core logic for a SaaS or subscription business:
Beginning Customers  = Prior Month Ending Customers
New Customers        = Beginning Customers × Growth Rate
Churned Customers    = Beginning Customers × Churn Rate
Ending Customers     = Beginning + New - Churned

MRR                  = Ending Customers × ARPU
Expansion MRR        = Prior Month MRR × Expansion Rate
Total MRR            = MRR + Expansion MRR
For e-commerce or transactional businesses, replace customer count with orders and ARPU with average order value.
Here's the thing: resist the urge to start with annual revenue targets and work backwards. That's a budget, not a model. Start with unit-level drivers (customers, ARPU, churn) and let the revenue number emerge from the assumptions. When an investor asks "what happens if churn doubles?", you want to change one cell and show them.
Worked example: Say you start with 50 customers paying $99/month, growing at 12% MoM with 4% monthly churn and 2% expansion revenue.
| Month | Starting | New | Churned | Ending | MRR | Expansion | Total MRR |
|---|---|---|---|---|---|---|---|
| 1 | 50 | 6 | 2 | 54 | $5,346 | $99 | $5,445 |
| 3 | 62 | 7 | 2 | 67 | $6,633 | $130 | $6,763 |
| 6 | 82 | 10 | 3 | 89 | $8,811 | $172 | $8,983 |
| 12 | 141 | 17 | 6 | 152 | $15,048 | $297 | $15,345 |
By month 12, you've tripled MRR without changing the assumptions. That compounding effect is what investors want to see, and it's exactly what breaks if churn creeps up even a couple of points.
Step 3: Build the Expense Forecast
Create an "Expenses" tab with the same monthly column structure. Break costs into two categories.
Fixed costs (don't scale with revenue):
- Salaries and benefits by role
- Office rent or coworking
- Software subscriptions
- Insurance and legal retainers
Variable costs (scale with customers or revenue):
- Cloud infrastructure (cost per customer per month)
- Payment processing fees (percentage of revenue)
- Customer support (cost per ticket or per customer)
- AI/LLM API costs (if applicable, and in 2026, it usually is)
One mistake we see constantly: founders lump "engineering" as a single line. Break it into headcount by role with a hire date for each position. This lets you model the step-function nature of salary costs, which matters for runway calculations.
Step 4: Connect the Cash Flow Statement
This tab pulls from Revenue and Expenses to show the monthly cash picture:
Monthly Revenue       = Total MRR from Revenue tab
Monthly Expenses      = Sum of all costs from Expenses tab
Net Burn Rate         = Monthly Expenses - Monthly Revenue
Beginning Cash        = Prior Month Ending Cash
Funding Received      = (One-time on funding close date)
Ending Cash           = Beginning Cash + Revenue - Expenses + Funding
Runway (months)       = Ending Cash / Net Burn Rate
The runway row is the most important output in the entire model. It answers "how many months until we run out of money at the current rate?" Track this monthly. If it drops below 6 months and you're not already in a fundraise, something needs to change.
For a deeper dive on the burn rate math, see the startup burn rate guide.
Calculate Your Revenue Growth
MRR Growth Calculator
Project your monthly recurring revenue based on customer growth and churn
Want to model this over 36 months with scenarios? Try Revenue Map free →
Step 5: Add Scenario Analysis
A single-scenario model is a guess pretending to be a forecast. Build three cases:
Base case: Your best estimate of what actually happens. Use the assumptions you believe are most likely.
Optimistic case: Growth is 1.5x your base, churn is 25% lower, and expansion revenue kicks in faster. This is the case you show investors to demonstrate upside.
Conservative case: Growth is 50% of base, churn is 25% higher, and that big partnership deal doesn't close. This is the case that determines whether you survive.
In Excel, the simplest approach is a dropdown cell in the Assumptions tab (use Data Validation) that switches between scenarios. Use IF or CHOOSE formulas to pull the right set of assumptions:
Growth Rate = CHOOSE(scenario_toggle, base_growth, optimistic_growth, conservative_growth)
When Canva cut its growth forecast by a third, that was essentially switching from their optimistic case to their conservative case. The companies that handle these shifts well are the ones that already modeled them. The ones that scramble are the ones that built a single-scenario model and treated it as truth.
Common Excel Modeling Mistakes
1. Hardcoding numbers in formulas. If you type =B12 * 0.05 instead of =B12 * churn_rate, you've created a landmine. When assumptions change (and they will), you'll miss updating this one formula buried in row 47 of the expenses tab. Every number that could change must reference the Assumptions tab.
2. Ignoring seasonality. SaaS businesses often see slower signups in December and faster ones in January. E-commerce has obvious holiday spikes. If your model shows perfectly smooth 12% monthly growth, it's aspirational, not realistic. Add a seasonality multiplier row to your revenue model.
3. Modeling revenue but not cash collection. Revenue and cash are different, especially for annual contracts. If a customer signs a $12,000 annual deal, you recognize $1,000/month in revenue but might collect $12,000 upfront. Your cash flow model needs to reflect when money actually hits the bank, not when you earn it on paper. The SaaS cash collection rate can differ significantly from recognized revenue.
4. Making the model too complex. A 15-tab model with cohort analysis, bottoms-up market sizing, and detailed departmental budgets sounds impressive, but breaks the first time someone else tries to use it. Start with 4 tabs (Assumptions, Revenue, Expenses, Cash Flow). Add complexity only when you have real data to support it.
Financial Model Benchmark Table
Use these ranges to sanity-check your model's outputs:
| Metric | Healthy Range | Warning Sign | Where to Look |
|---|---|---|---|
| Monthly customer growth | 8-20% | Declining 2+ months | Revenue tab |
| Monthly churn rate | 2-5% (SMB), under 1% (Enterprise) | Rising trend | Revenue tab |
| Gross margin | 65-80% (SaaS) | Under 60% | Expenses tab |
| Burn rate trend | Flat or declining | Rising faster than revenue | Cash Flow tab |
| Runway | 18-24 months post-raise | Under 12 months | Cash Flow tab |
| LTV:CAC ratio | 3:1 or higher | Under 2:1 | Derived from Revenue + Expenses |
If your outputs fall outside these ranges, that's a question you need to answer before an investor asks it.
Key Takeaways
- Start with the Assumptions tab, every number that might change lives here as a named range, not hardcoded in a formula buried three tabs deep
- Build revenue from unit drivers (customers, ARPU, churn, expansion), not top-down annual targets; this makes the model responsive to real changes
- Three scenarios are the minimum: base, optimistic, and conservative; the companies that survive shocks are the ones that already modeled them
- Track runway monthly as the primary output of your cash flow tab; if it drops below 12 months, you're in the danger zone
- Keep it simple: 4 tabs (Assumptions, Revenue, Expenses, Cash Flow) handle 90% of what a seed-stage startup needs
The best financial model is one you actually use. Start with a clean spreadsheet and the steps above, or skip the blank-page problem and build your SaaS model in Revenue Map. You can also create a free account to access templates with built-in scenario analysis and benchmarks.
Related Articles
Three-Statement Financial Model Template
How to build a three-statement financial model that connects your income statement, balance sheet, and cash flow. Includes template, formulas, and startup examples.
Budget vs Forecast vs Projection for Startups
Budgets, forecasts, and projections serve different purposes. Learn when to use each and how they connect in your startup financial plan.
Financial Modeling Software for Startups (2026)
Compare the best financial modeling software for startups, from spreadsheets to AI-native tools. Features, pricing, and when to upgrade from Excel.