Agency Financial Model: Revenue, Utilization, Margins
An agency financial model forecasts revenue by multiplying billable headcount by utilization rate and effective hourly rate. Healthy agencies target 65 to 75 percent utilization and 50 to 60 percent gross margins on delivery.
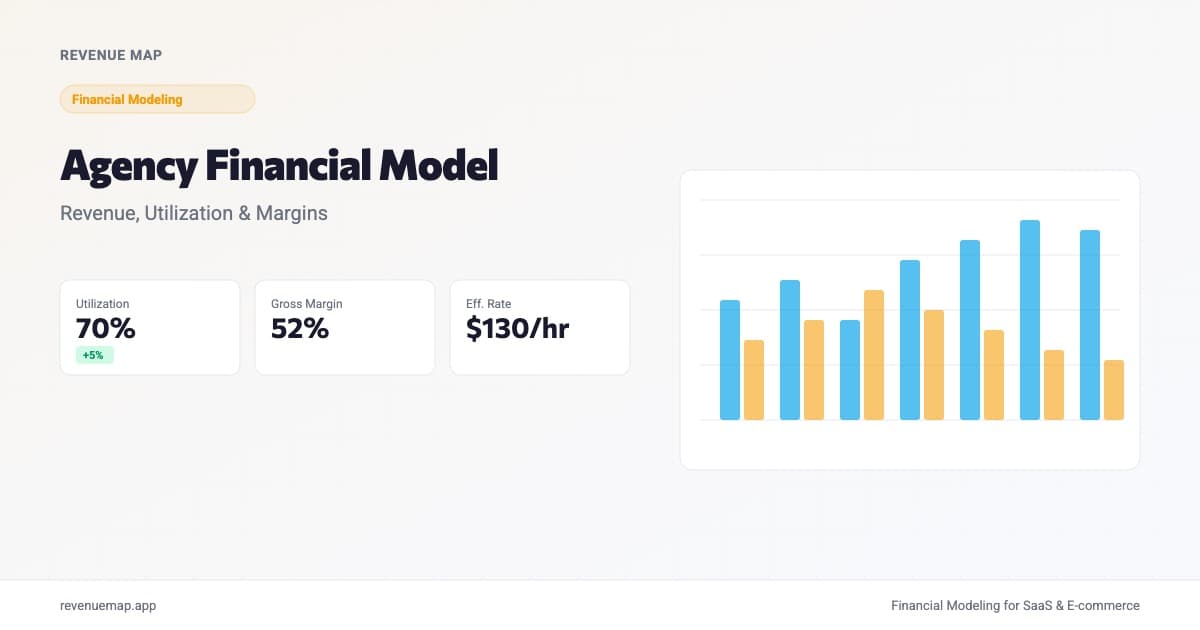
An agency financial model forecasts how much revenue your team can produce based on headcount, utilization rates, and effective billing rates. If you run a digital, marketing, or consulting agency, this is the model that connects your hiring decisions to actual profit. Without one, you're guessing whether that next hire will generate margin or just add burn.
This matters more than usual right now. SaaStr's latest analysis warns that renewal revenue "stopped being safe" for B2B companies, and agencies feel this acutely because client concentration makes every lost account painful. A proper agency financial model stress-tests retention scenarios so you know exactly how many new logos you need to keep growing.
What Is an Agency Financial Model?
An agency financial model is a capacity-based revenue forecast that starts with your team rather than a top-line growth target. Instead of saying "we'll hit $3M this year," you say "we have 12 billable people working at 70% utilization with an effective rate of $130/hour, which gives us $X in monthly capacity."
The core formula:
Monthly Revenue = Billable Staff × Utilization Rate × Effective Rate × Hours/Month
This approach differs fundamentally from SaaS financial modeling, where revenue scales with subscriber count and software pricing tiers. Agency revenue scales with people. Every hire is both a cost center and a revenue engine, which makes the capacity math more consequential. If you run a hybrid agency that also sells a software product, you may want the SaaS model template alongside your capacity model to keep both revenue streams separate.
Why Your Agency Needs a Financial Model
Three reasons agency founders underestimate this:
People are your largest cost and your only revenue source. In most agencies, labor accounts for 55-70% of total costs. Unlike a software product, you can't serve one more client without either hiring or stretching your existing team thinner. The financial model makes that constraint explicit and forces you to plan around it.
Client concentration creates hidden risk. If your top three clients represent 40% of revenue, losing one isn't a setback. It's a crisis. SaaStr's "net-new-logo test" applies here directly: the model should show what happens when any single client churns, and how many months it takes to replace that revenue through your pipeline.
Pricing mistakes compound quietly. Underpricing by $20/hour across a team of 15 people at 70% utilization means roughly $176,000 in lost annual revenue. Most agency owners discover pricing errors only when margins start to tighten. A financial model catches them before they compound into a cash flow problem.
How to Build an Agency Financial Model
Step 1: Define Your Revenue Capacity
Start with the variables you can actually count:
| Input | Example Value | How to Find It |
|---|---|---|
| Billable staff | 12 | Headcount minus leadership, sales, ops, admin |
| Target utilization | 70% | Billable hours divided by total available hours |
| Effective hourly rate | $130 | Actual revenue per billable hour, not your list rate |
| Monthly available hours | 168 | About 21 working days at 8 hours each |
The "effective rate" distinction matters more than most founders realize. If you quote $150/hour but scope creep, write-offs, and fixed-fee overruns bring actual realized revenue down to $115/hour, your model needs to use $115. Closing the gap between quoted and effective rates is one of the fastest ways to improve agency margins.
12 staff × 0.70 utilization × $130/hour × 168 hours = $183,456/month
That's your monthly revenue capacity. Annualized: roughly $2.2M. Notice that this number is a ceiling, not a forecast. Your actual revenue depends on whether you can sell and retain enough client work to keep utilization at target.
Step 2: Model Your Cost Structure
Agency costs fall into three buckets:
Direct delivery costs (cost of services sold): salaries and benefits for billable staff, contractor costs, and software tools used in delivery. Think of this as your COGS equivalent. For a healthy agency, direct costs should run 40-50% of revenue, leaving 50-60% gross margins.
Overhead: office or coworking space, insurance, accounting, legal, non-billable software tools. Budget 10-15% of revenue.
Sales and leadership: founder salary, account managers, business development headcount. Budget 15-25% of revenue depending on your growth stage and go-to-market approach.
Gross Margin = (Revenue - Direct Delivery Costs) / Revenue × 100
If your 12-person agency produces $183K/month and direct delivery costs are $88K (an average loaded cost of about $7,300 per billable person), your gross margin is 52%. That's healthy. Below 40% means you're either overcompensating relative to your rates or underpricing relative to your talent's market value.
Step 3: Model Client Retention and New Logo Pipeline
Here's the part most agency models skip entirely. You need to model how many new clients you must win each quarter just to stay flat, before you can even think about growth.
Assume your agency has 18 active clients. If annual logo retention is 85% (typical for a well-run agency), you lose roughly 3 clients per year. If average client value is $10K/month, that's $30K in monthly revenue you need to replace just to maintain your current run rate.
Monthly Revenue to Replace = (1 - Annual Retention Rate) × Total Monthly Revenue
New Clients Needed per Month = Revenue to Replace / Avg New Client Monthly Value
For our example: (1 - 0.85) x $183K = $27.5K/month in new revenue needed, or roughly 3 new clients per month at $10K each. Factor in your close rate (say 25%) and average sales cycle (say 45 days), and you can calculate the pipeline volume required to feed that funnel.
If you track customer acquisition cost for your agency (total sales and marketing spend divided by new clients won), you can also model acquisition efficiency. Most agencies spend 5-10% of revenue on business development, but surprisingly few measure whether that spend actually converts.
Step 4: Run Scenario Analysis
Build three scenarios by adjusting utilization and retention. This is where the model earns its keep:
| Scenario | Utilization | Client Retention | Annual Revenue | Net Margin |
|---|---|---|---|---|
| Base | 70% | 85% | $2.2M | 15% |
| Upside | 75% | 92% | $2.5M | 22% |
| Stress | 60% | 78% | $1.7M | 3% |
The stress case answers the question every agency founder should be asking: "What happens if we lose our biggest client and utilization drops in the same quarter?" If the stress scenario puts you below break-even, you need either a larger cash buffer or a faster pipeline to derisk. For a deeper look at how much reserve you need, see our guide on startup burn rate and runway calculations.
Calculate Your Agency Revenue
Agency Revenue Calculator
Estimate monthly revenue capacity from your billable team
Want to model this over 36 months with scenarios? Try Revenue Map free →
2026 Agency Benchmarks
| Metric | Strong | Healthy | Needs Attention |
|---|---|---|---|
| Billable Utilization | 75%+ | 65-75% | Below 60% |
| Gross Margin | 60%+ | 50-60% | Below 40% |
| Effective vs. Quoted Rate | 95%+ | 85-95% | Below 80% |
| Annual Client Retention | 90%+ | 80-90% | Below 75% |
| Revenue per Employee | $200K+ | $150-200K | Below $120K |
| Net Profit Margin | 20%+ | 10-20% | Below 8% |
Benchmarks vary enormously by agency type. A two-person dev shop billing $200/hour looks nothing like a 50-person content agency billing $85/hour. Use these as calibration points, then track your own trends quarter over quarter. The trend matters more than the absolute number.
Common Mistakes in Agency Financial Modeling
-
Confusing utilization targets with actuals. You plan for 75% utilization, but internal projects, meetings, and unbilled admin eat up more time than expected. Track actuals weekly and use trailing 90-day averages in your model rather than aspirational targets.
-
Ignoring ramp time for new hires. A new strategist or developer takes 2-4 weeks before they're staffed on a billable project. During that time they're a pure cost. Model a ramp factor for each new hire, just like you would in a SaaS sales capacity model.
-
Using list rates instead of effective rates. Your model should reflect actual realized revenue per hour after discounts, scope creep, and write-downs. If your $150 list rate translates to $120 effective, the model needs to use $120.
-
No client concentration analysis. If any single client accounts for more than 20% of revenue, your model should include a scenario where that client leaves. This is the agency version of what SaaStr calls the "net-new-logo test": can you replace a major account before cash flow suffers?
-
Blending staff and contractor margins. Agencies often use freelancers for overflow work. Contractor margins typically land at 15-30%, well below the 50-65% margins on full-time staff. If your model doesn't separate staff and contractor revenue, it will overstate profitability during growth spurts when contractor usage spikes.
Key Takeaways
- An agency financial model is capacity-driven: revenue equals billable heads times utilization times effective rate times hours. Every hire changes both sides of the equation.
- Target 65-75% utilization and 50-60% gross margins for a sustainable agency. Pushing above 80% utilization is a burnout risk, not a growth strategy.
- Model client retention explicitly. If you assume every client renews, you'll miss the pipeline gap that appears when 2-3 accounts churn in the same quarter.
- Close the gap between your quoted rate and effective rate. Every $10/hour leak across a 10-person team costs over $140K per year.
- Run a stress scenario with 60% utilization and 78% retention. If it breaks your model, you need a bigger cash buffer or a faster sales engine.
Revenue forecasting without a capacity model is just hope wrapped in a spreadsheet. The agencies that grow profitably are the ones that model the machine: how many people, billing at what rate, producing at what margin. Build your agency financial model in Revenue Map and connect your hiring plan directly to your profit forecast.
Related Articles
Cash Flow Projection Template for Small Business
Build a 12-month cash flow projection your lender will trust. Includes formulas, a free calculator, and line-by-line examples for restaurants, coffee shops, and more.
SaaS Revenue Model Template for Startups
Build a SaaS revenue model from scratch with MRR components, pricing tier math, and expansion revenue. Includes a free calculator and benchmarks.
Budget vs Forecast vs Projection for Startups
Budgets, forecasts, and projections serve different purposes. Learn when to use each and how they connect in your startup financial plan.