SaaS Revenue Model Template for Startups
A SaaS revenue model template projects monthly recurring revenue by breaking it into four components: new MRR, expansion MRR, contraction MRR, and churned MRR. Build it by defining pricing tiers, estimating customer acquisition per tier, and applying historical churn and expansion rates month over month.
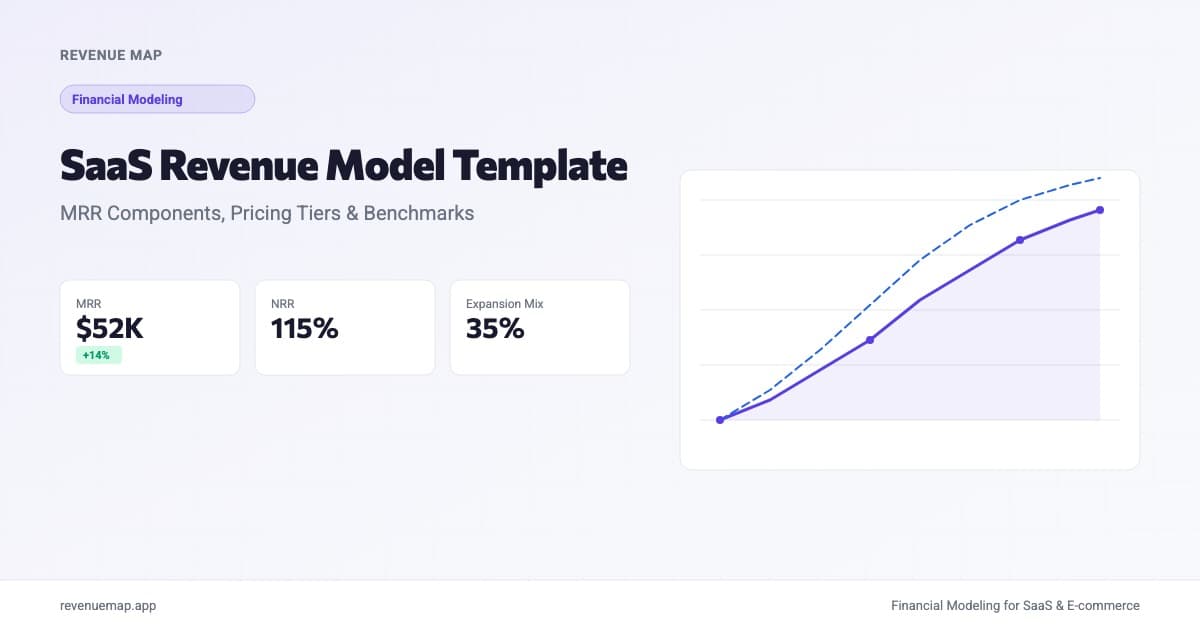
A SaaS revenue model template breaks your subscription revenue into four components: new MRR, expansion MRR, contraction MRR, and churned MRR. Build it by defining pricing tiers, estimating customer acquisition per tier, and applying historical churn and expansion rates to project revenue month over month. It is the single most scrutinized section of any startup financial model, and getting it right separates credible fundraising decks from fantasy spreadsheets.
The structure matters more than ever in a volatile market. SaaStr's September 2026 analysis of the "SaaSpocalypse" recovery found that the SaaS software index (IGV ETF) rebounded roughly 40% from its low, but the recovery was uneven. Companies with diversified revenue streams and strong net revenue retention recovered faster than those dependent on a single pricing tier and net-new logos alone. Your revenue model needs to capture that nuance.
What Is a SaaS Revenue Model?
A SaaS revenue model is a bottom-up projection of how a subscription business generates recurring revenue. Unlike a simple growth-rate forecast ("we'll grow 15% monthly"), it models the individual mechanics that produce revenue: how many customers you acquire, what they pay, how many upgrade, and how many leave.
The core formula that drives every SaaS revenue model:
MRR (Month N) = MRR (Month N-1) + New MRR + Expansion MRR - Contraction MRR - Churned MRR
Each component is driven by different inputs and controlled by different teams. New MRR depends on marketing and sales. Expansion MRR depends on product and customer success. Churn depends on onboarding quality, product-market fit, and competitive pressure. Modeling them separately is the only way to build projections you can actually debug when reality diverges from the plan.
This is distinct from a full SaaS financial model, which layers cost structure, cash flow, and scenario planning on top of the revenue model. Think of the revenue model as the engine. The financial model is the entire car.
The Four Components of SaaS Revenue
| Component | Definition | Typical Driver | Benchmark Range |
|---|---|---|---|
| New MRR | Revenue from first-time customers | Marketing spend, sales capacity | Varies by stage |
| Expansion MRR | Revenue increase from existing customers (upsells, add-ons, usage growth) | Product adoption, pricing tiers | 20-40% of gross new MRR |
| Contraction MRR | Revenue decrease from downgrades | Feature gaps, budget cuts | 1-3% of starting MRR |
| Churned MRR | Revenue lost from cancellations | Product-market fit, onboarding | 3-7% monthly (SMB), 0.5-1.5% (Enterprise) |
The ratio between these components determines your net revenue retention. When expansion exceeds contraction plus churn, your NRR lands above 100%, meaning your existing customer base grows even without new sales. Top-performing SaaS companies sustain NRR above 120%.
How to Build a SaaS Revenue Model: Step by Step
Step 1: Define Your Pricing Tiers
Start by listing every pricing tier or plan your product offers. For each tier, record:
- Monthly price (or the monthly equivalent of annual pricing)
- Target customer segment (SMB, mid-market, enterprise)
- Current customer count in that tier
- Historical mix of new signups by tier
Most SaaS companies have 2-4 tiers. If you also offer usage-based pricing, model the base subscription and the variable component separately. Our usage-based pricing guide covers how to handle metered revenue in your model.
Here is the thing: your tier mix matters as much as your total customer count. A company with 500 customers on a $29/month plan and 10 customers on a $499/month plan gets 63% of its MRR from those 10 enterprise accounts. Losing two of them hits harder than losing fifty starter-tier customers. Model each tier independently.
Step 2: Estimate Monthly Customer Acquisition
For each tier, estimate how many new customers you will acquire per month. Use your actual sales funnel data where possible:
New Customers (Tier) = Qualified Leads × Conversion Rate
If you are pre-revenue or early stage, use comparable benchmarks. Seed-stage SaaS companies typically acquire 10-30 new customers per month. Series A companies target 30-100, depending on deal size and sales cycle.
One common mistake: assuming acquisition scales linearly with marketing spend. It rarely does. Your CAC tends to rise as you exhaust early-adopter channels and move into broader markets. Build a step function into your model, not a straight line.
Step 3: Set Churn and Expansion Assumptions
Churn and expansion rates are the two assumptions that make or break your model's credibility. Set them from actual data wherever possible, not aspirational targets.
| Segment | Monthly Logo Churn | Monthly Revenue Churn | Net Revenue Retention (Annual) |
|---|---|---|---|
| SMB (self-serve) | 5-8% | 3-7% | 80-95% |
| Mid-market | 2-4% | 1.5-3% | 95-110% |
| Enterprise | 0.5-1.5% | 0.5-1.5% | 110-130% |
For expansion, model two sources separately. Seat-based expansion (teams adding users) is relatively predictable from historical per-account growth. Usage-based expansion (customers hitting higher tiers) is lumpier and depends on product engagement patterns. If your product has a natural "land and expand" motion, your expansion MRR should grow as a percentage of your base over time, not stay flat.
Step 4: Wire the Monthly MRR Formula
With your inputs defined, the monthly calculation follows a standard pattern. Here is a simplified version for one tier:
New MRR         = New Customers × Tier Price
Expansion MRR   = Starting MRR × Expansion Rate
Contraction MRR = Starting MRR × Contraction Rate
Churned MRR     = Starting MRR × Revenue Churn Rate

Net New MRR     = New MRR + Expansion MRR - Contraction MRR - Churned MRR
Ending MRR      = Starting MRR + Net New MRR
Repeat for each tier and sum across tiers for total MRR. Then project forward 12-24 months. For fundraising, extend to 36 months, but flag anything beyond 24 months as directional only.
The honest answer is that the model gets complex quickly once you add annual contracts (which create deferred revenue timing differences), seasonal acquisition patterns, and planned pricing changes. Start simple, then add complexity as your data justifies it.
Step 5: Convert MRR to ARR and Recognized Revenue
ARR is simply MRR multiplied by 12. But recognized revenue requires more nuance if you offer annual or multi-year contracts. Revenue recognition follows delivery, not cash collection, which is why your cash collection rate deserves its own line in the model.
ARR = MRR × 12
Recognized Revenue (Monthly) = MRR (if monthly billing) or Annual Contract / 12 (if annual billing)
Calculate Your MRR Growth
SaaS MRR Growth Calculator
Project your next month's MRR from the four revenue components
Want to model this over 36 months with scenarios? Try Revenue Map free →
SaaS Revenue Model Benchmarks by Stage
| Stage | Monthly MRR Growth | New MRR Mix | Expansion MRR Mix | Gross Churn |
|---|---|---|---|---|
| Pre-seed (under $10K MRR) | 15-25% | 90-100% | 0-10% | 5-10% |
| Seed ($10K-$50K MRR) | 12-20% | 75-85% | 15-25% | 4-7% |
| Series A ($50K-$200K MRR) | 8-15% | 60-70% | 30-40% | 3-5% |
| Series B+ ($200K+ MRR) | 5-10% | 50-60% | 40-50% | 2-4% |
Notice the pattern: as companies mature, the share of growth from expansion revenue increases while reliance on net-new logos decreases. This is the hallmark of a durable SaaS revenue model. If you are still generating 90% of growth from new customers at the Series A stage, your pricing and packaging likely need rework. Our SaaS pricing strategy guide covers how to design tiers that encourage natural expansion.
Common Revenue Model Mistakes
-
Modeling MRR as a single line. Aggregating all revenue into one growth rate hides the mechanics. When you miss your number, you cannot diagnose whether the problem was acquisition, churn, or expansion without separating the components.
-
Using logo churn instead of revenue churn. If your highest-paying customers churn at lower rates than your smallest accounts (which is common), logo churn overstates your revenue impact. Always model revenue churn separately from customer churn.
-
Ignoring contraction. Downgrades are not the same as cancellations, but they erode MRR just as reliably. Founders routinely leave contraction out of their models, which inflates NRR and creates a gap between projected and actual revenue that widens every month.
-
Flat acquisition assumptions. Modeling "30 new customers per month" for 24 straight months ignores that your sales team gets better over time (good) but your market gets more competitive (bad). Build in a ramp for sales hires and a slight increase in CAC as you move beyond early adopters.
-
Annual contracts without cash timing. A customer who signs a $12,000 annual contract contributes $1,000/month to MRR, but the cash may arrive upfront, quarterly, or net-30. If your revenue model does not account for billing frequency, your cash flow projection will be wrong. Cross-reference with a three-statement model to capture the full picture.
Key Takeaways
- A SaaS revenue model breaks MRR into four components (new, expansion, contraction, churn) rather than applying a single growth rate. This makes your projections auditable and your variance analysis actionable.
- Model each pricing tier independently. Tier mix shifts can swing your blended ARPU by 30% or more, which compounds across 12-24 months of projections.
- Set churn and expansion rates from actual historical data, not targets. Investors and board members will pressure-test these numbers first.
- As your company matures, expansion MRR should grow as a share of total new MRR. If it is not, revisit your pricing tiers and upsell motions.
- The revenue model is the top layer of your financial model. Once it is solid, layer on your cost structure, cash flow, and startup financial projections for the complete picture.
Building a revenue model from scratch takes time, but starting from a proven template cuts the work dramatically. Try Revenue Map to generate your SaaS revenue model in minutes, then customize the assumptions with your own data.
Related Articles

SaaS Financial Modeling: Complete Guide (2026)
Step-by-step SaaS financial model with MRR forecasting, unit economics, scenario planning, and key metrics. Free template included.
B2B SaaS Financial Model: Templates and Benchmarks
Build a B2B SaaS financial model with enterprise sales cycles, annual contracts, and expansion revenue. Includes 2026 benchmarks and a free ARR calculator.
Revenue Forecast Template for Startups (2026)
Build a revenue forecast from scratch. Grab our template with MRR growth formulas, churn adjustments, and expansion revenue built in.