Cash Flow Projection Template for Small Business
A cash flow projection template forecasts your monthly cash inflows and outflows over 12 months or more. Lenders require it for SBA and bank loan applications to verify your business can cover debt payments, and a good one includes revenue, operating expenses, loan payments, and a running cash balance.
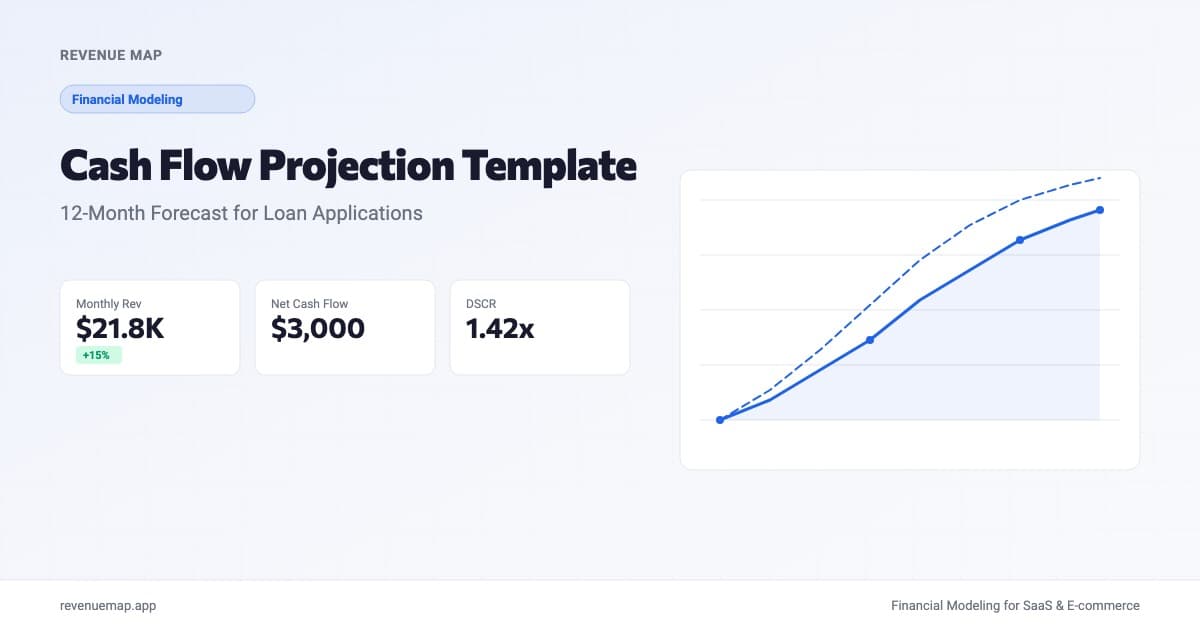
A cash flow projection template maps out every dollar flowing into and out of your business, month by month, so you can see exactly when cash runs tight and when there is room to invest. If you are applying for a business loan or SBA financing, this is the document that tells the lender whether your business can make its payments. Without it, most applications stall.
Getting this right matters more than usual in late 2026. The Federal Reserve raised interest rates for the first time since 2023, which means higher monthly payments on new SBA and conventional business loans. A projection built six months ago with a 7.5% rate assumption may now understate your debt service by hundreds of dollars a month. If your numbers do not reflect the current rate environment, a lender will notice before you do.
What Does a Cash Flow Projection Include?
A cash flow projection is a month-by-month forecast of your business's cash inflows (money coming in) and cash outflows (money going out), ending with a running balance that shows how much cash you have on hand at any given point. The structure is straightforward:
Ending Cash Balance = Beginning Cash + Total Inflows - Total Outflows
Most projections follow a three-section layout:
| Section | What It Covers | Examples |
|---|---|---|
| Cash Inflows | All sources of incoming cash | Sales revenue, loan proceeds, owner investment, other income |
| Cash Outflows | All cash leaving the business | Rent, payroll, supplies, insurance, loan payments, taxes, equipment |
| Net Cash Flow | Inflows minus outflows, plus running balance | Monthly surplus or deficit, cumulative cash position |
Here's the thing: this sounds simple on paper but gets tricky in practice. Revenue rarely arrives in a straight line. A coffee shop might do $8,000 in its first month and $18,000 by month six. A restaurant might collect $45,000 in December and $28,000 in February. Your projection needs to capture that seasonality and ramp-up curve, not average everything out.
How to Build a 12-Month Cash Flow Projection
Step 1: Estimate Monthly Revenue
Build revenue from the bottom up using observable inputs, not top-down guesses. For a physical business, the formula is:
Monthly Revenue = Daily Customers x Average Ticket x Days Open per Month
For a coffee shop projecting its first year, that might look like 80 customers per day at a $6.50 average ticket over 26 operating days, which gives you roughly $13,500 in month one. Most lenders expect you to show a ramp: lower traffic in the early months building toward a steady state by month six or eight.
If you are opening a restaurant, a food truck, or a gym, the same logic applies with different inputs. The key is anchoring every number to something you can defend. "The shopping center sees 12,000 daily visitors and our landlord's tenant data shows a 2.5% capture rate for food tenants" is defensible. "We expect $50,000 in monthly revenue" without context is not.
Worth noting: buying restaurant equipment online has become standard practice for operators reducing upfront costs. If your projection includes equipment purchases, document whether you are buying new, used, or leasing, because lenders evaluate use-of-funds line by line.
Step 2: List All Monthly Operating Expenses
Group your outflows into fixed and variable categories. Fixed costs stay roughly the same regardless of sales volume. Variable costs scale with revenue. Here is a typical breakdown for a small brick-and-mortar business:
Fixed costs (monthly):
- Rent and CAM charges
- Base payroll (salaried employees)
- Insurance (liability, property, workers' comp)
- Loan payments (principal + interest)
- Software and subscriptions
- Accounting and legal retainers
Variable costs (monthly):
- Cost of goods sold (food, supplies, inventory)
- Hourly labor above base staffing
- Credit card processing fees (typically 2.5% to 3.5% of revenue)
- Utilities (partially variable)
- Marketing spend
The mistake that kills most first-time projections is underestimating variable costs as a percentage of revenue. For restaurants, cost of goods sold runs 28% to 35% of revenue. For coffee shops, it is closer to 25% to 30%. If your projection shows COGS at 15%, a lender will flag it immediately. Cross-check your assumptions against industry benchmarks, and if you need help pulling those together for your specific business type, the startup cost calculator covers equipment, inventory, and operating reserves for common trades.
Step 3: Add Debt Service as a Separate Line
This is the line your lender will check first. Debt service includes both principal and interest payments on the loan you are applying for, plus any existing debt.
With rates rising, the payment amount matters more than it did a year ago. Here is how the same $200,000 SBA loan looks at different rates:
| Loan Amount | Rate | Term | Monthly Payment |
|---|---|---|---|
| $200,000 | 7.5% | 10 years | $2,372 |
| $200,000 | 8.25% | 10 years | $2,453 |
| $200,000 | 9.0% | 10 years | $2,534 |
That $162 monthly difference between 7.5% and 9.0% adds up to nearly $1,950 per year. In a business running on 10% cash flow margins, that is real money. Build your projection at the current rate, not the rate you hope to get.
The metric lenders care about most is the debt service coverage ratio (DSCR):
DSCR = Net Operating Income / Total Debt Payments
Most banks and SBA lenders require a DSCR of at least 1.25x, meaning your business generates 25% more cash from operations than it needs for loan payments. If your projection shows a DSCR below 1.0x at any point in the first 12 months (other than a brief ramp-up period), expect questions. Our guide to writing a business plan for a loan covers the full DSCR calculation with examples.
Calculate Your Monthly Cash Flow
Monthly Cash Flow Calculator
Estimate your monthly net cash flow and debt service coverage ratio
Want to model this over 36 months with scenarios? Try Revenue Map free →
Step 4: Calculate Monthly Net Cash Flow and Running Balance
For each month, subtract total outflows from total inflows. Then carry the ending balance forward as the next month's beginning balance. Here is a simplified example for a coffee shop's first six months:
| Month | Cash In | Cash Out | Net Flow | Ending Balance |
|---|---|---|---|---|
| 1 | $13,500 | $19,200 | -$5,700 | $32,300 |
| 2 | $15,800 | $18,400 | -$2,600 | $29,700 |
| 3 | $17,200 | $18,100 | -$900 | $28,800 |
| 4 | $19,000 | $18,300 | $700 | $29,500 |
| 5 | $20,500 | $18,500 | $2,000 | $31,500 |
| 6 | $21,800 | $18,800 | $3,000 | $34,500 |
This example assumes a $38,000 starting cash reserve (working capital from the loan). The business burns cash for three months, breaks even in month four, and builds a small surplus from there. That is exactly the pattern lenders expect for a new location: a short ramp followed by stabilization. If you are not sure when your business will cross that threshold, the break-even analysis guide walks through the math.
That said, if your ending balance dips below zero in any month, your projection has a problem. Either increase the working capital reserve in your loan request, reduce costs during the ramp period, or show a more conservative revenue timeline.
What Lenders Flag in a Cash Flow Projection
After reviewing the numbers, lenders typically look for these red flags:
-
Revenue that jumps too fast. Going from $10,000 to $40,000 in month two without a clear explanation (a catering contract, a pre-sold membership drive) will get questioned. Show a gradual ramp unless you have documentation for the spike.
-
Missing seasonal dips. Every physical business has a slow season. If your 12-month projection shows perfectly flat or always-increasing revenue, it looks unrealistic. A restaurant in a college town should show lower revenue in summer. A gym should show a January spike and a June dip.
-
COGS below industry benchmarks. If the average restaurant runs 30% food cost and your projection shows 18%, explain why. Maybe you are counter-service only with a limited menu. But the number needs context.
-
No owner draw or salary. If you are running the business full time but your projection shows zero compensation for you, the lender knows it is not sustainable. Include a realistic owner draw, even if it is modest in year one.
-
Debt service coverage below 1.25x. As noted above, this is the threshold most lenders use. Your projection needs to show DSCR above 1.25x for at least 9 of the 12 months after the initial ramp period. If it does not, consider whether the loan amount or the business model needs adjustment.
Cash Flow Projection vs. Profit and Loss Statement
These two documents answer different questions, and lenders want both. Here is the distinction:
| Cash Flow Projection | Profit & Loss (P&L) | |
|---|---|---|
| Basis | Cash basis (when money moves) | Accrual basis (when earned/incurred) |
| Includes | Loan proceeds, loan payments, equipment purchases | Revenue, COGS, operating expenses |
| Excludes | Depreciation, accounts receivable timing | Loan principal, cash reserves |
| Answers | "Will we have cash to pay bills?" | "Is the business profitable?" |
A business can show a profit on the P&L but still run out of cash. This is common in the first year when large upfront costs (equipment, buildout, deposits) hit the cash flow statement as lump sums but get spread across years on the P&L through depreciation. Your cash flow projection captures that reality. For a deeper look at how these fit together in a loan package, see the financial projections template guide.
Running a Scenario Analysis
A single projection is useful. Three projections are convincing. Build base, downside, and upside scenarios:
- Base case: Your honest best estimate, built from the bottom-up assumptions above.
- Downside case: Revenue 20% below base, costs 10% above. If the business still covers debt service at 80% of projected revenue, you have a strong application.
- Upside case: Revenue 15% above base, anchored to a plausible driver (adding catering, extending hours, launching delivery).
The lender will focus on the downside case. Track your burn rate across all three scenarios to understand how much working capital you truly need.
Key Takeaways
- A cash flow projection tracks the actual timing of money in and money out, which matters more to lenders than profitability on paper.
- Build revenue from bottom-up assumptions (daily customers, average ticket, days open) rather than top-down revenue targets.
- With interest rates rising in 2026, use the current rate environment when calculating loan payments. A difference of 0.75% on a $200,000 loan changes your monthly payment by roughly $80 to $160.
- Every projection should show DSCR above 1.25x after the ramp period. If yours does not, revisit the loan amount, the timeline, or the cost structure.
- Include three scenarios (base, downside, upside) and make sure the downside case still covers debt service.
Ready to build the projection for your specific business? Run the numbers in Revenue Map, free, two minutes. Pick your industry, plug in your assumptions, and get a month-by-month cash flow forecast you can hand to a lender.
Related Articles
Business Plan for a Business Loan: What to Include
Learn exactly what lenders want in a business plan for a loan. Covers financial projections, cash flow, DSCR, and use-of-funds with real examples.
SaaS Revenue Model Template for Startups
Build a SaaS revenue model from scratch with MRR components, pricing tier math, and expansion revenue. Includes a free calculator and benchmarks.
Budget vs Forecast vs Projection for Startups
Budgets, forecasts, and projections serve different purposes. Learn when to use each and how they connect in your startup financial plan.