Ecommerce Financial Model: How to Build One
An ecommerce financial model projects revenue, costs, and profit for an online retail business. It starts with traffic and conversion assumptions, builds up to gross merchandise volume, then layers in cost of goods sold, fulfillment, marketing spend, and operating expenses to produce a monthly P&L and cash flow forecast.
An ecommerce financial model is a structured, bottom-up projection that translates traffic, conversion, and order data into revenue, costs, and cash flow forecasts for an online retail business. Unlike a simple revenue guess, it connects every assumption to a formula so you can stress-test scenarios and make informed decisions about inventory, marketing spend, and hiring.
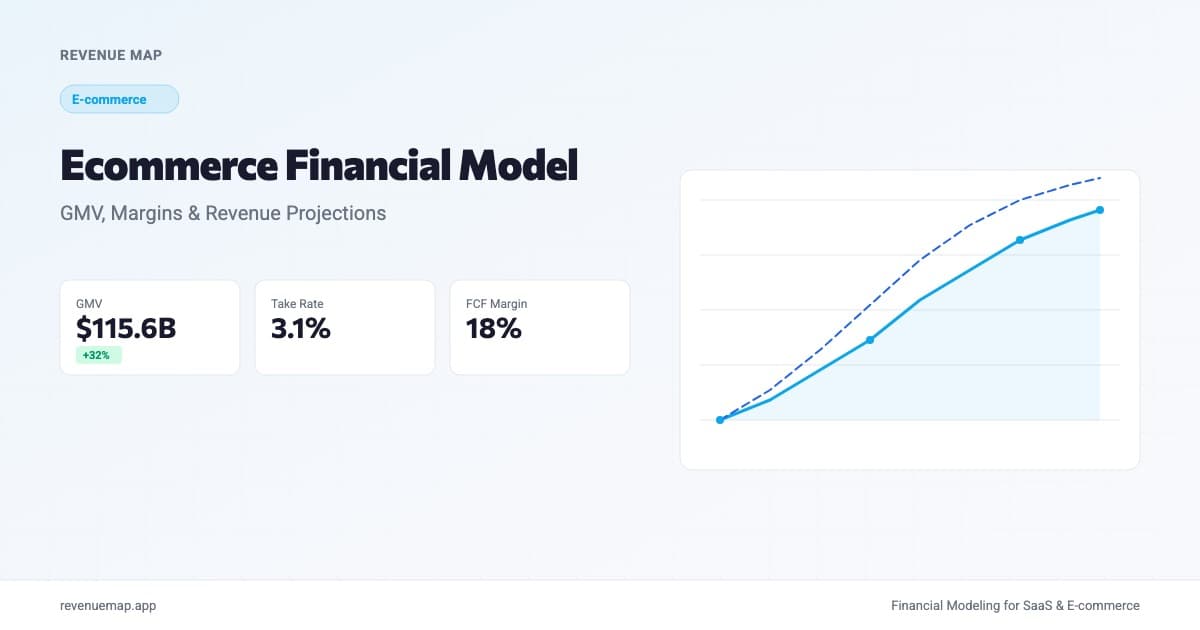
This matters more in 2026 than it did two years ago. According to SaaStr's analysis of Shopify's Q2 2026 earnings, the platform posted $3.58 billion in quarterly revenue (up 34% year-over-year) on $115.6 billion in gross merchandise volume. Shopify also reported that AI-powered orders grew 3x and free cash flow margins hit 18%. Those numbers provide real benchmarks you can use to calibrate your own model, whether you sell on Shopify or compete with merchants who do.
What Is an Ecommerce Financial Model?
An ecommerce financial model is a dynamic framework that projects how your online business generates revenue, incurs costs, and consumes or produces cash over a 12- to 24-month horizon. It has three layers:
- Revenue model: traffic, conversion, AOV, and repeat purchases flowing into gross merchandise volume and net revenue
- Cost model: COGS, fulfillment, marketing spend, and operating expenses
- Cash model: when cash actually arrives and leaves, accounting for payment processor holds, inventory prepayments, and seasonality
The key difference between an ecommerce financial model and a SaaS model is the revenue engine. SaaS builds on monthly recurring revenue with predictable subscription income. Ecommerce revenue is transactional: it depends on order volume, which fluctuates with seasons, promotions, and ad spend. That makes the assumptions layer more complex, but the core structure is the same. If you have built a SaaS financial model, you already know the framework. The inputs just change.
How Is This Different from Unit Economics?
Ecommerce unit economics tells you whether a single customer or order is profitable. It answers: does my LTV:CAC ratio work? Is my AOV high enough to cover acquisition costs?
A financial model uses unit economics as inputs, then projects the full business: hundreds or thousands of customers over many months, with fixed costs layered in. Unit economics might show a healthy 3:1 LTV:CAC ratio. The financial model shows that you still run out of cash in month 9 because you front-loaded inventory purchases for Q4.
Here's the honest answer: you need both. Unit economics validates the core business logic. The financial model validates the timeline and the bank account.
Key Components of an Ecommerce Revenue Model
Traffic and Conversion
Every ecommerce financial model starts with the same two inputs: how many people visit your store, and what percentage buy something.
Monthly Revenue = Monthly Visitors x Conversion Rate x Average Order Value
Most DTC stores convert at 2 to 4% of visitors. Niche stores with high purchase intent can hit 5 to 8%. Marketplaces typically convert lower (1 to 3%) because browsers are comparison-shopping.
Your model should break traffic into channels: organic search, paid social, paid search, email, and direct. Each channel has a different customer acquisition cost and conversion rate. Blending them into a single number hides the economics of each source and makes it impossible to model what happens when you shift budget between channels.
GMV and Take Rate
If you operate a marketplace or platform, gross merchandise volume (GMV) is the total dollar value of transactions processed through your platform. Your actual revenue is a fraction of GMV:
Net Revenue = GMV x Take Rate
Shopify's Q2 2026 numbers illustrate this clearly. With $115.6 billion in GMV and $3.58 billion in revenue, Shopify's effective take rate is approximately 3.1%. That number includes subscription fees, payment processing, and value-added services like Shopify Capital and shipping labels.
Take rates vary widely by platform model:
| Platform Type | Typical Take Rate | Example |
|---|---|---|
| Payment processing only | 2 to 3% | Stripe, Square |
| Marketplace (light touch) | 5 to 10% | Etsy, eBay |
| Managed marketplace | 15 to 25% | Amazon FBA, DoorDash |
| Full-stack platform | 3 to 5% | Shopify (blended) |
| Vertical commerce SaaS | 8 to 15% | Faire, Mable |
For DTC brands selling direct, the "take rate" concept doesn't apply. Your revenue equals your selling price minus discounts and returns.
Average Order Value and Repeat Purchases
Average order value is the revenue per transaction. But modeling AOV alone misses half the picture. What matters for the P&L projection is revenue per customer over time, which depends on repeat purchase behavior.
Annual Revenue Per Customer = AOV x Annual Purchase Frequency
A DTC skincare brand with a $45 AOV and 4.2 annual purchases generates $189 per customer per year. A furniture retailer with a $680 AOV but 1.1 annual purchases generates $748, but needs to acquire a new customer for nearly every sale.
Model these separately. Your repeat rate determines how much of your marketing budget goes to acquisition versus retention, and that split changes your financial model dramatically.
Building the Cost Structure
Cost of Goods Sold
COGS for ecommerce includes the landed cost of products (manufacturing, raw materials, import duties) plus inbound freight. For DTC brands, this typically runs 30 to 40% of revenue. For resellers buying wholesale, it can be 50 to 70%.
Fulfillment and Shipping
Fulfillment costs include warehousing, pick-and-pack labor, packaging materials, and outbound shipping. Depending on your model:
- Self-fulfilled: $3 to $8 per order for small items, scaling with volume
- 3PL (third-party logistics): $5 to $15 per order, more predictable
- FBA or marketplace fulfillment: 15 to 30% of item price, inclusive
Shopify's push into fulfillment and logistics is one reason their take rate has expanded over time. For your model, separate fulfillment costs from COGS so you can see contribution margin after delivery.
Marketing and Customer Acquisition
Your customer acquisition cost is the single most volatile line in an ecommerce financial model. CAC for paid social has risen significantly since 2022, and most DTC brands now spend $25 to $80 to acquire a customer through Meta or Google ads.
Model CAC by channel and by month. In Q4, CPMs spike 30 to 50% due to holiday competition, which means your December CAC will be materially higher than your February CAC. If your model uses a flat annual average, you will overestimate profitability in Q4 and underestimate it the rest of the year.
Operating Expenses
Fixed costs that don't scale linearly with orders: team salaries, software subscriptions (your ecommerce platform, email marketing, analytics), rent if applicable, and professional services (accounting, legal). These form your operating expense baseline.
The AI Factor in 2026 Ecommerce Models
Shopify's report that AI-powered orders grew 3x quarter-over-quarter is a signal worth modeling. AI is showing up in ecommerce in three financially meaningful ways:
- AI-generated product descriptions and images: reduces content creation costs by 40 to 60%, particularly for stores with large catalogs
- AI-powered search and recommendations: lifts conversion rates by 10 to 25% according to early adopter data, which directly improves your revenue-per-visitor metric
- AI customer service (chatbots, automated returns): reduces support headcount needs, shifting the cost from a variable to a fixed line
If you are building a financial model for a new ecommerce business in 2026, include an assumption for AI-driven conversion improvement. Even a conservative 10% lift in conversion rate can meaningfully change your breakeven timeline and customer acquisition economics.
Calculate Your Ecommerce Revenue
Ecommerce Revenue Calculator
Estimate monthly revenue from traffic and conversion assumptions
Want to model this over 36 months with scenarios? Try Revenue Map free →
Ecommerce Financial Model Benchmarks (2026)
Use these ranges to sanity-check your assumptions. If any of your inputs fall far outside these bands, you either have a genuinely differentiated business or an error in your model.
| Metric | Strong | Average | Weak |
|---|---|---|---|
| Conversion Rate | 4%+ | 2 to 3% | Under 1.5% |
| Gross Margin (DTC) | 65%+ | 50 to 65% | Under 45% |
| Contribution Margin | 25%+ | 15 to 25% | Under 10% |
| CAC Payback | Under 3 months | 3 to 6 months | Over 8 months |
| Repeat Purchase Rate (12mo) | 40%+ | 25 to 35% | Under 20% |
| LTV:CAC Ratio | 4:1+ | 2.5:1 to 4:1 | Under 2:1 |
| Free Cash Flow Margin | 15%+ | 5 to 15% | Negative |
For context, Shopify's platform-level numbers in Q2 2026 show 18% free cash flow margin and 34% revenue growth, representing the upper tier of what a scaled ecommerce infrastructure business can achieve. Your DTC store won't look like Shopify's P&L, but the margin structure gives you a ceiling to benchmark against.
Common Mistakes in Ecommerce Financial Models
-
Using a flat CAC across all months. Seasonality in ad costs is real. CPMs in November and December can be 30 to 50% higher than spring. Model CAC monthly, not annually.
-
Ignoring cash flow timing. You pay suppliers 30 to 60 days before customers pay you (or before payment processors release funds). A profitable P&L can coexist with a negative cash balance if you don't model working capital.
-
Conflating revenue with GMV. If you run a marketplace, your revenue is GMV times your take rate, not the total transaction value. This error inflates your model by 5 to 30x.
-
Modeling AOV without repeat rates. A $200 AOV means very different things if customers buy once versus four times a year. Always pair AOV with purchase frequency to get annual revenue per customer.
-
Skipping the scenario layer. Build at least three cases: base, conservative (20% fewer visitors, 15% higher CAC), and optimistic (10% conversion lift, 20% higher repeat rate). The gap between your conservative and optimistic case is your uncertainty band. If it is wider than 3x, your assumptions need more research.
Key Takeaways
- An ecommerce financial model starts bottom-up from traffic, conversion rate, and AOV, not from a top-down revenue growth percentage.
- Separate your model into revenue, cost, and cash flow layers. Profitable months on paper can still create cash crunches if you pre-purchase inventory.
- Use real benchmarks to calibrate: 2 to 4% conversion, $25 to $80 CAC for paid channels, 25 to 40% annual repeat rates for most DTC categories.
- AI-driven conversion and content improvements are becoming a material input. Even a conservative assumption of 10% conversion lift changes your breakeven math.
- Unit economics validates the per-customer model. The financial model validates the whole business over time. You need both.
Ready to build your ecommerce financial model? Start with Revenue Map's ecommerce template, it walks you through each assumption and generates your projections automatically. Create your free account and have your first model draft in under 10 minutes.
Related Articles
DTC Financial Model: Revenue, Margins, and CAC
How to build a direct-to-consumer financial model with COGS, blended CAC, and LTV formulas. Includes 2026 DTC benchmarks and a contribution margin calculator.
Subscription Box Financial Model: Costs, Margins, and LTV
Build a subscription box financial model with COGS, fulfillment, and churn formulas. Includes benchmarks and a contribution margin calculator.

Ecommerce Unit Economics: 2026 Benchmarks for AOV, CAC, LTV
Calculate AOV, CAC, and LTV for your online store with step-by-step formulas. Includes 2026 benchmarks by vertical and the 3:1 LTV:CAC profitability rule.