Subscription Box Financial Model: Costs, Margins, and LTV
A subscription box financial model forecasts monthly recurring revenue, product costs, fulfillment, and shipping per subscriber. The key metric is contribution margin per box, which should be 40% or higher. Most subscription boxes see 8 to 12% monthly subscriber churn, much higher than SaaS.
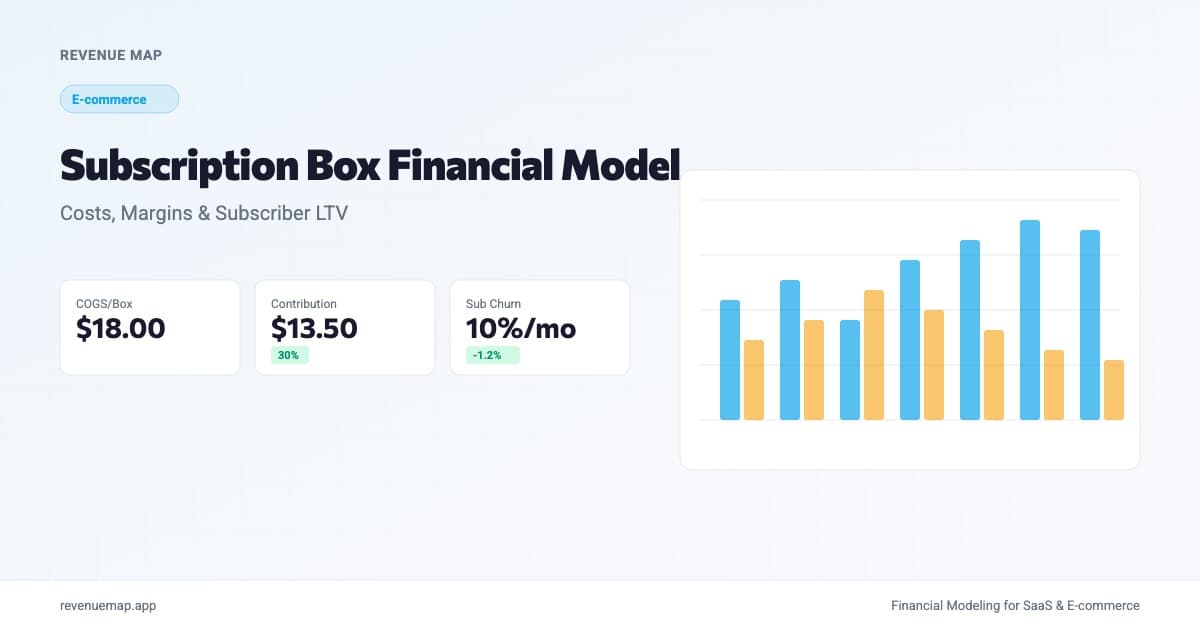
A subscription box financial model projects your monthly subscriber count, revenue, and the per-box costs that determine whether your business is viable at scale. The core calculation: take your subscription price, subtract product costs (COGS), fulfillment, and shipping to get your contribution margin per box. That margin, divided by your monthly churn rate, gives you subscriber lifetime value. If that LTV doesn't clear 3x your acquisition cost, the model breaks.
Subscription boxes are sometimes called "physical SaaS" because of recurring revenue. The comparison is misleading. SaaS businesses run at 70-80% gross margins. Box businesses, after product, packing, and postage, are often closer to 30-45%. That gap changes everything about how you model growth, acquisition spend, and runway.
What Is a Subscription Box Financial Model?
A subscription box financial model is a spreadsheet or tool that forecasts subscriber growth, revenue, and costs for a business shipping curated physical products on a recurring schedule. It differs from a standard e-commerce unit economics model in three important ways.
First, revenue is recurring but not sticky. Unlike SaaS, where switching costs create natural retention, box subscribers can cancel with a click if one shipment disappoints. Monthly churn runs 8-15%, roughly three to five times higher than software.
Second, variable costs scale with every subscriber. Each new customer means another box of products, another fulfillment labor charge, and another shipping label. There is no zero-marginal-cost delivery like software. If you're building a general online store instead, an e-commerce model covers those dynamics. But subscription boxes need their own approach.
Third, the cost structure has more components. A SaaS model tracks hosting and support. A box model tracks COGS per box, packaging materials, pick-and-pack labor, shipping by weight and zone, and often returns or damaged shipments. Miss any one of these and your margins look better than they actually are.
How to Forecast Subscriber Revenue
Start with your subscriber count and work forward month by month:
End Subscribers = Start Subscribers + New Subscribers - Churned Subscribers
Monthly Revenue = End Subscribers x Subscription Price
Worked example: You start Month 1 with 500 subscribers at $45/month. You acquire 120 new subscribers and churn 10% of your starting base.
End Subscribers = 500 + 120 - 50 = 570
Monthly Revenue = 570 x $45 = $25,650
The compounding effect of churn is what kills most box models. Even at 10% monthly churn, you need to replace half your subscriber base every six months just to stay flat. This is why understanding churn rate calculation matters before you build anything else in the model.
One nuance worth modeling: prepaid plans. Many box businesses offer 3-month or 6-month prepaid subscriptions at a discount. These reduce churn (customers commit upfront) but lower effective monthly revenue. Model these as a separate cohort with their own average revenue and churn schedule.
Cost Structure: COGS, Fulfillment, and Shipping
Here is where subscription boxes diverge most sharply from software businesses. Your cost per box has three layers, and each one scales linearly with subscriber count.
| Cost Component | Typical Range (% of Price) | What It Includes |
|---|---|---|
| COGS (product) | 30-50% | Wholesale cost of items in the box |
| Fulfillment | 8-15% | Pick, pack, quality check, packaging materials |
| Shipping | 12-20% | Carrier rates by weight and zone, insurance |
| Total variable | 50-85% | Sum of all per-box costs |
Worked example with a $45 box:
COGS:        $18.00 (40%)
Fulfillment:  $5.50 (12%)
Shipping:     $8.00 (18%)
Total Cost:  $31.50 (70%)
Contribution: $13.50 (30%)
That 30% contribution margin needs to cover customer acquisition, overhead (team, software, warehouse lease), and eventually profit. If your gross margin after variable costs is below 25%, the math gets extremely difficult.
Here's the thing: even operational costs you'd expect to automate away remain stubbornly physical. SaaStr recently reported that teams running 20+ AI agents alongside just three humans still depend on structured B2B software for operations. The same principle applies to box businesses. AI can help with product curation algorithms and customer service automation, trimming headcount. But procurement, warehousing, and shipping remain hands-on. Model your fixed overhead accordingly.
Calculate Your Contribution Margin Per Box
Contribution Margin Calculator
Calculate the margin on each subscription box you ship
Want to model this over 36 months with scenarios? Try Revenue Map free →
How to Calculate Subscriber LTV
Once you know your contribution margin per box, you can calculate how much each subscriber is worth over their lifetime:
Subscriber LTV = Contribution Margin Per Box / Monthly Churn Rate
Using our example: $13.50 contribution margin and 10% monthly churn.
LTV = $13.50 / 0.10 = $135
That $135 sets a hard ceiling on acquisition spend. If your CAC exceeds $45 (to maintain a 3:1 ratio), you either need to improve margins, reduce churn, or accept that the model doesn't work at your current price point. This is the same LTV calculation logic used in SaaS, but the inputs are dramatically different because of the layered cost structure.
The honest answer is that most subscription box LTVs fall between $80 and $200. Compare that to SaaS, where LTVs of $2,000-$10,000 are common. This compressed LTV means your acquisition channels need to be efficient. Paid social at $40-60 per acquisition can work. Influencer partnerships that run $15-30 per converted subscriber are even better.
Subscription Box Benchmarks by Category
| Category | Monthly Price | COGS % | Monthly Churn | Contribution Margin |
|---|---|---|---|---|
| Beauty/cosmetics | $25-50 | 35-45% | 10-14% | 25-35% |
| Meal kits | $60-120 | 45-55% | 12-18% | 15-25% |
| Pet supplies | $30-45 | 30-40% | 6-10% | 30-40% |
| Hobby/craft | $35-55 | 35-50% | 8-12% | 25-35% |
| Snacks/food | $20-40 | 40-55% | 10-15% | 20-30% |
| Kids/education | $30-50 | 35-45% | 8-12% | 28-38% |
Pet and kids/education boxes tend to have the best retention because the recipient (pet, child) creates an emotional switching cost the subscriber feels. Meal kits have the worst retention, partly because cooking fatigue is real and partly because the category is saturated with promotional pricing that trains customers to churn and re-subscribe for the discount.
Common Modeling Mistakes
-
Ignoring shipping zone variation. Flat-rate shipping estimates understate costs. A box going from California to New York costs significantly more than one going to Nevada. Model shipping by weighted average across your actual subscriber geography, or build in a 15-20% buffer over your best-case rate.
-
Using SaaS churn benchmarks. A 5% monthly churn assumption will make any box model look incredible. It will also be wrong. Use category-specific churn from the table above, or better yet, your own cohort data after the first three months of operation.
-
Forgetting returns and damaged shipments. Physical goods get lost, arrive damaged, or get returned. Budget 2-4% of revenue for this line item. It looks small per box but compounds across thousands of shipments per month.
-
Modeling COGS as a flat line. Your product cost per box changes as you scale. Bulk purchasing discounts reduce COGS at higher volumes, but supplier minimums and inventory carrying costs work against you in the early months. Model COGS as a step function that drops at specific volume thresholds.
-
Skipping the break-even calculation. Know exactly how many subscribers you need before contribution margin covers your fixed costs (team, warehouse, software). For most box businesses, this number falls between 2,000 and 5,000 active subscribers.
Break-even Subscribers = Monthly Fixed Costs / Contribution Margin Per Box
Key Takeaways
- Contribution margin per box (price minus COGS, fulfillment, and shipping) is the single most important number in your model. Target 30-40% or higher.
- Monthly subscriber churn of 8-15% is normal for box businesses. Plan your acquisition spend around replacing roughly half your base every six months.
- LTV for subscription boxes typically falls between $80 and $200, which means your CAC ceiling is $25-65 to maintain a healthy 3:1 ratio.
- Model shipping costs by zone, not as a flat average. The difference between local and cross-country delivery can swing margins by 5-10 percentage points.
- Break-even for most subscription box startups lands between 2,000 and 5,000 active subscribers, depending on your fixed cost structure.
Ready to model your subscription box? Build your financial model with Revenue Map and see your unit economics in minutes.
Related Articles
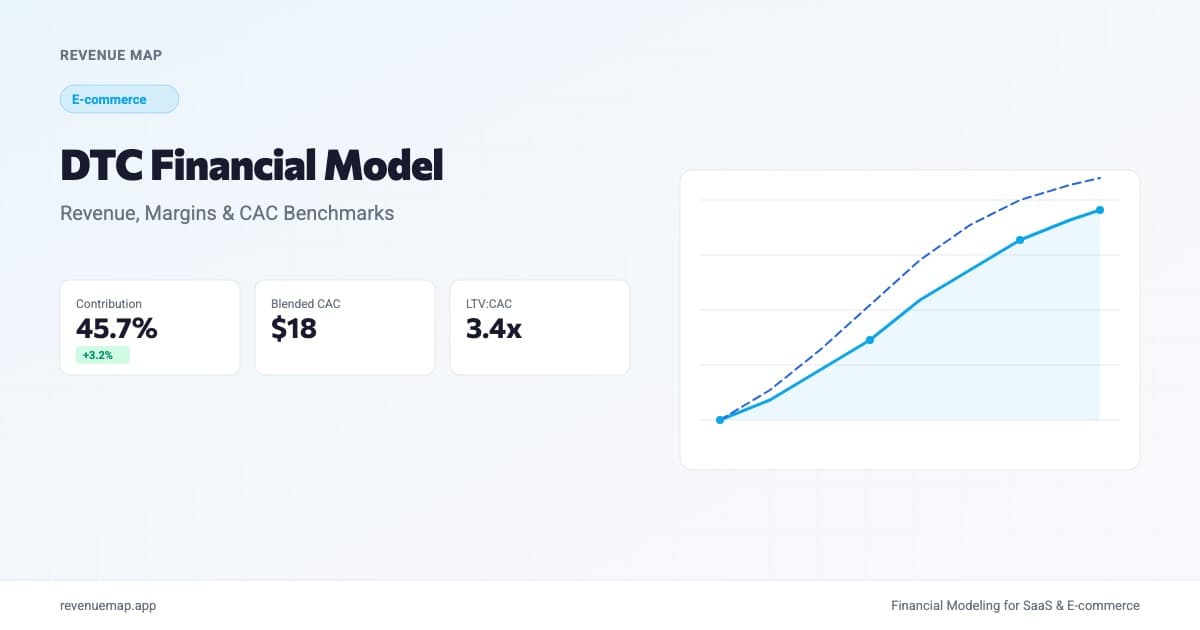
DTC Financial Model: Revenue, Margins, and CAC
How to build a direct-to-consumer financial model with COGS, blended CAC, and LTV formulas. Includes 2026 DTC benchmarks and a contribution margin calculator.
Ecommerce Financial Model: How to Build One
Step-by-step guide to building an ecommerce financial model with GMV projections, margin assumptions, and 2026 benchmarks from real companies.

Ecommerce Unit Economics: 2026 Benchmarks for AOV, CAC, LTV
Calculate AOV, CAC, and LTV for your online store with step-by-step formulas. Includes 2026 benchmarks by vertical and the 3:1 LTV:CAC profitability rule.