DTC Financial Model: Revenue, Margins, and CAC
A DTC financial model forecasts revenue, cost of goods sold, customer acquisition cost, and lifetime value for a direct-to-consumer brand. The key metric is contribution margin per order, which should be 40% or higher after product costs, fulfillment, and shipping. Healthy DTC brands target a 3:1 or better LTV to CAC ratio using margin-adjusted LTV.
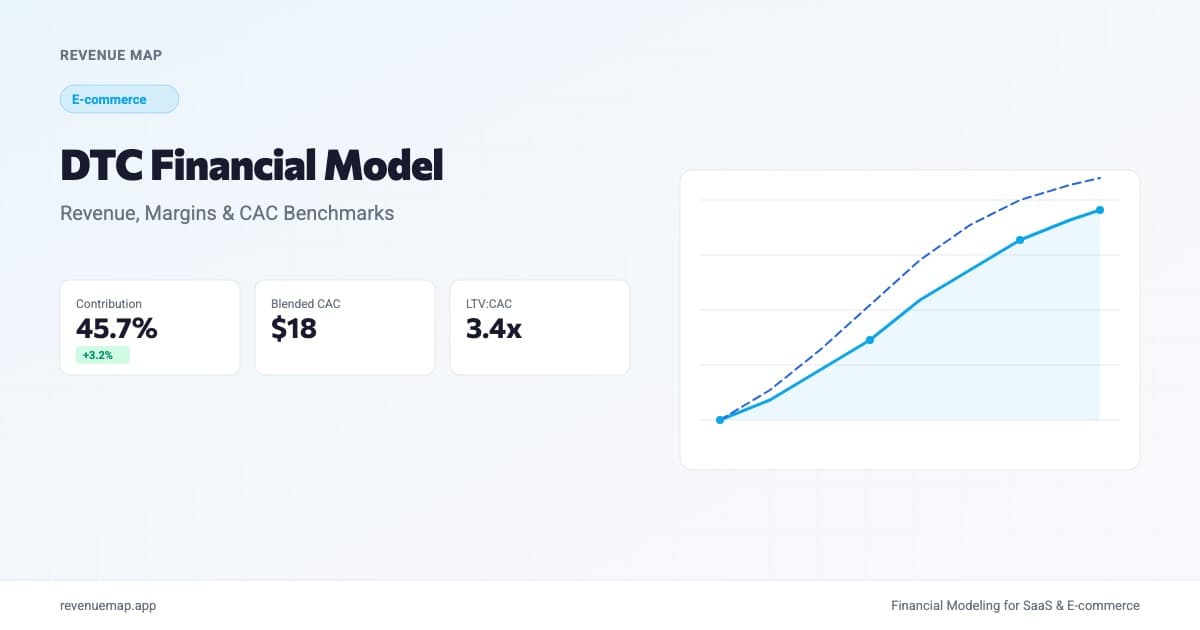
A DTC financial model projects revenue, product costs, and customer acquisition expenses for a brand that sells directly to consumers, bypassing retailers, wholesalers, and marketplace platforms. The core calculation: take your average order value, subtract COGS, fulfillment, and shipping to get your contribution margin per order. Then compare your margin-adjusted lifetime value against your blended customer acquisition cost. If that ratio doesn't clear 3:1 at scale, the business model has a structural problem.
DTC brands have been raising significant capital on the promise of cutting out the middleman. Atorie just raised $9.5 million to sell luxury handbags and clothing sourced from the same factories as high-end brands, without the brand markup. The pitch is compelling: same quality, lower price, higher margin for the brand. But that only works if the full cost structure, from manufacturing through last-mile delivery, actually supports the economics. That is what a DTC financial model is built to test.
What Is a DTC Financial Model?
A DTC financial model is a projection of monthly revenue, costs, and cash flow for a brand that owns its customer relationship end to end. It differs from a general e-commerce financial model in three structural ways.
First, you own the product. DTC brands either manufacture or source products directly, which means your model needs a detailed COGS line: raw materials, production labor, packaging, quality control, and inbound freight. A marketplace seller uses the supplier's price as a given. A DTC brand controls (and must forecast) the entire cost stack.
Second, you own the customer. Without marketplace traffic, every customer comes through channels you pay for: paid social, search, influencer partnerships, content marketing, or retail partnerships. Your model needs a blended CAC calculation across all channels, not just a single "marketing spend divided by customers" line. The mix matters because channel economics differ dramatically.
Third, you own the brand. Brand-building spend (creative production, PR, community management) isn't strictly CAC because it doesn't convert in the same measurement window. But it's a real cost that DTC brands carry and marketplace sellers largely skip. Your model should separate brand spend from performance marketing to avoid muddying your CAC calculations.
How to Forecast DTC Revenue
DTC revenue is a function of traffic, conversion, and order value across channels. Start with the bottom-up formula:
Monthly Revenue = Site Visitors x Conversion Rate x AOV
Then expand by channel:
Total Revenue = (Paid Traffic x Paid CVR x AOV)
              + (Organic Traffic x Organic CVR x AOV)
              + (Email/SMS List x Campaign Frequency x Click Rate x CVR x AOV)
              + (Retail/Wholesale Units x Wholesale Price)
Worked example: A DTC skincare brand with 120,000 monthly site visitors, 2.8% conversion rate, and $68 average order value:
Monthly Revenue = 120,000 x 0.028 x $68 = $228,480
Break this down by channel to expose the real economics:
| Channel | Visitors | CVR | Orders | Revenue | CAC |
|---|---|---|---|---|---|
| Paid Social | 54,000 | 2.2% | 1,188 | $80,784 | $42 |
| Organic/SEO | 36,000 | 3.5% | 1,260 | $85,680 | $8 |
| Email/SMS | 30,000 | 4.1% | 1,230 | $83,640 | $3 |
| Total | 120,000 | 2.8% | 3,678 | $250,104 | $18 |
The blended CAC of $18 looks healthy, but paid social at $42 per customer is five times more expensive than organic. As you scale, the mix usually shifts toward paid (organic doesn't scale linearly with spend), which pushes blended CAC upward. Model that shift explicitly or your projections will be too optimistic.
DTC Cost Structure: What Goes Into COGS
DTC gross margin comes from controlling the supply chain. Here is a typical cost breakdown for a DTC fashion brand selling a $95 product:
| Cost Component | Amount | % of Revenue |
|---|---|---|
| Raw materials | $14.25 | 15% |
| Manufacturing labor | $9.50 | 10% |
| Packaging and labels | $3.80 | 4% |
| Inbound freight | $2.85 | 3% |
| Quality control | $1.90 | 2% |
| Total COGS | $32.30 | 34% |
| Gross Margin | $62.70 | 66% |
That 66% gross margin is what makes DTC attractive relative to wholesale (where retailers take 50%+ of the final price). But gross margin is not contribution margin. You still need to subtract fulfillment, shipping, and transaction fees:
Contribution Margin = Revenue - COGS - Fulfillment - Shipping - Payment Processing
Continuing the example:
Revenue:              $95.00
COGS:                -$32.30
Fulfillment (3PL):    -$4.50
Shipping:             -$7.20
Payment processing:   -$2.85 (3% of revenue)
Returns allowance:    -$4.75 (5% of revenue)
─────────────────────────────
Contribution Margin:  $43.40 (45.7%)
That 45.7% contribution margin is the number your financial model should optimize around. It tells you how much each order actually contributes toward covering fixed costs (team, rent, software) and eventually generating profit.
Calculate Your DTC Contribution Margin
DTC Contribution Margin Calculator
Calculate your per-order contribution margin after all variable costs
Want to model this over 36 months with scenarios? Try Revenue Map free →
How to Calculate DTC Customer Lifetime Value
Standard LTV calculations use gross margin. For DTC, you should use contribution margin instead, because fulfillment and shipping are real per-order costs that eat into what each customer is actually worth.
DTC LTV = AOV x Annual Purchase Frequency x Contribution Margin % x Customer Lifespan (years)
Worked example: Skincare brand with $68 AOV, 2.4 purchases per year, 45% contribution margin, 2.5-year average lifespan:
DTC LTV = $68 x 2.4 x 0.45 x 2.5 = $183.60
Without the margin adjustment, that number would be $408, more than double the real figure. Using revenue LTV instead of contribution-margin LTV would lead you to believe you can spend $136 per customer (at a 3:1 target) when your real ceiling is $61.
Why Repeat Purchase Rate Is the Key Lever
The single most important variable in DTC economics is repeat purchase rate. A first order rarely pays back the acquisition cost. Consider the math:
| Scenario | First Purchase | 2nd Purchase | 3rd Purchase | Cumulative Margin |
|---|---|---|---|---|
| One-time buyer | $43.40 | -- | -- | $43.40 |
| Repeat buyer (2x/yr) | $43.40 | $43.40 | -- | $86.80 |
| Loyal buyer (3x/yr) | $43.40 | $43.40 | $43.40 | $130.20 |
If your blended CAC is $42, a one-time buyer barely breaks even. A repeat buyer gives you a 2:1 return. A loyal buyer delivers 3:1. The difference between a struggling DTC brand and a thriving one is almost always retention, not acquisition.
This is why subscription models have become so popular in DTC: they lock in repeat purchases and make LTV more predictable. If you're modeling a subscription DTC product, see our guide on subscription box financial models for the specific formulas.
DTC Benchmarks by Category
These ranges are drawn from publicly reported data and typical venture-backed DTC brands. Use them as directional guidance for your financial model, not hard targets.
| Metric | Fashion/Apparel | Beauty/Skincare | Food/Beverage | Home Goods |
|---|---|---|---|---|
| Gross Margin (product) | 65-80% | 70-85% | 45-60% | 55-70% |
| Contribution Margin/Order | 40-55% | 45-60% | 25-40% | 35-50% |
| AOV | $80-150 | $55-90 | $35-65 | $90-200 |
| Blended CAC | $35-65 | $25-50 | $20-40 | $40-75 |
| Annual Purchase Frequency | 2-3x | 3-5x | 6-12x | 1.5-2.5x |
| Customer Lifespan | 2-3 years | 2-4 years | 1.5-3 years | 2-3 years |
| LTV:CAC Ratio | 2.5-4:1 | 3-5:1 | 2-3.5:1 | 2-3:1 |
| Return Rate | 15-30% | 3-8% | 1-3% | 8-15% |
Beauty and skincare has the strongest unit economics (high margins, frequent repurchase, low returns), which explains why the category dominates DTC success stories. Food and beverage has the weakest margins but the highest purchase frequency, making it viable only at scale or with a subscription model.
DTC vs. Wholesale vs. Marketplace: When DTC Wins
Here is how the economics compare across distribution models for the same $95 product:
| Factor | DTC (Own Site) | Wholesale to Retailer | Marketplace (Amazon) |
|---|---|---|---|
| Selling price to brand | $95.00 | $47.50 (50% markup) | $95.00 |
| COGS | -$32.30 | -$32.30 | -$32.30 |
| Platform/retailer fees | $0 | $0 | -$14.25 (15% referral) |
| Fulfillment | -$4.50 | Retailer handles | -$8.50 (FBA) |
| Shipping | -$7.20 | FOB to retailer | Included in FBA |
| Customer acquisition | -$18.00 (blended) | Minimal | -$9.50 (PPC) |
| Net margin per unit | $33.00 (34.7%) | $15.20 (32.0%) | $30.45 (32.1%) |
DTC wins on margin, but the advantage is smaller than the gross margin gap suggests. Customer acquisition is the equalizer. Most successful DTC brands use a hybrid approach: DTC for margin and customer data, wholesale for awareness, marketplace for volume.
Common Mistakes in DTC Financial Models
1. Using revenue LTV instead of margin-adjusted LTV. This is the most frequent error. At 45% contribution margin, revenue LTV overstates the customer's value by more than double. Every CAC decision built on revenue LTV will be systematically wrong. See our detailed guide on e-commerce unit economics for the correct calculation.
2. Modeling CAC as flat across scale. Your CAC at $50K monthly revenue will be lower than at $500K. The cheapest customers convert first. As you exhaust high-intent audiences and push into broader targeting, paid CAC rises 30-50%. Model this step-up explicitly by applying a CAC inflation factor of 1-3% monthly as you scale paid spend.
3. Ignoring the return rate. Fashion DTC brands see 15-30% return rates. That is not just lost revenue; it is wasted fulfillment, shipping, and sometimes product cost. Your contribution margin must include a returns allowance.
Key Takeaways
- DTC financial models differ from general e-commerce because you own manufacturing, customer acquisition, and the brand: higher margins, but also higher fixed costs and working capital needs
- Contribution margin per order, not gross margin, is the metric that matters: subtract fulfillment, shipping, payment processing, and returns from your gross margin to get the real number
- Target 40%+ contribution margin and 3:1 margin-adjusted LTV:CAC as baseline benchmarks; beauty and skincare can exceed this, while food and beverage will run tighter
- Repeat purchase rate is the most powerful lever: moving from 1.5 to 2.5 annual purchases can double your LTV without touching acquisition spend
- Model CAC inflation as you scale: blended CAC rises as you exhaust high-intent audiences, so project a 1-3% monthly increase in paid CAC at higher spend levels
- Account for working capital: inventory lead times of 60-90 days mean your cash burn is front-loaded relative to revenue, which directly affects runway
Building a DTC brand that works on paper is different from building one that works in the real world. Revenue Map's e-commerce financial model template lets you plug in your actual COGS, channel mix, and repeat rates to see exactly where your contribution margin lands. Start building yours now.
Related Articles
Subscription Box Financial Model: Costs, Margins, and LTV
Build a subscription box financial model with COGS, fulfillment, and churn formulas. Includes benchmarks and a contribution margin calculator.
Ecommerce Financial Model: How to Build One
Step-by-step guide to building an ecommerce financial model with GMV projections, margin assumptions, and 2026 benchmarks from real companies.

Ecommerce Unit Economics: 2026 Benchmarks for AOV, CAC, LTV
Calculate AOV, CAC, and LTV for your online store with step-by-step formulas. Includes 2026 benchmarks by vertical and the 3:1 LTV:CAC profitability rule.