Last updated
Ecommerce Unit Economics: AOV, CAC, LTV Formulas (2026)
E-commerce unit economics measure the revenue, cost, and profit generated by a single customer. The three core metrics are average order value, customer lifetime value, and customer acquisition cost. A healthy LTV to CAC ratio for a DTC brand is 3 to 1 or above, using margin-adjusted LTV, not revenue LTV.
By Tim Kozin

Ecommerce unit economics measure the revenue, cost, and profit generated by a single customer, and whether acquiring that customer was worth it. The three metrics that define this are average order value (AOV), customer lifetime value (LTV), and customer acquisition cost (CAC). The ratio that ties them together, LTV:CAC, is the single most important number for determining whether your e-commerce business is building value or quietly destroying it.
What Are Ecommerce Unit Economics?
Ecommerce unit economics are defined as the direct revenues and costs associated with acquiring and retaining a single customer, used to determine whether the business model is fundamentally profitable at the customer level.
This is distinct from P&L-level profitability. A business can show growing revenue on its income statement while its unit economics are deeply negative, spending $90 to acquire customers worth $60 at the margin. That gap compounds with scale. The faster you grow with negative unit economics, the faster you destroy value. Understanding unit economics is what separates founders who scale profitably from those who discover the problem after they've spent the marketing budget.
Unit economics answer one question: for every dollar you spend acquiring a customer, how many dollars do you get back, and over what time period?
The Three Metrics That Define E-commerce Profitability
AOV, LTV, and CAC are not three separate metrics to track in isolation. They form a dependency chain. AOV is an input into LTV. LTV is compared against CAC to produce the ratio that tells you whether your business model works. Optimizing any one of them in isolation, without understanding how it moves the others, produces incomplete and sometimes misleading conclusions.
Average Order Value (AOV)
AOV is defined as the average revenue generated per transaction, calculated by dividing total revenue by the number of orders in a given period.
AOV = Total Revenue / Number of Orders
If your store generated $42,500 from 500 orders last month, your AOV is $85.
AOV is the most actionable short-term lever in e-commerce unit economics. Three mechanisms move it: product bundling (grouping complementary SKUs at a slight discount), upsell prompts at checkout (suggesting a higher-tier or add-on product), and free shipping thresholds (setting the free shipping minimum 15–20% above your current AOV, customers will add items to qualify). Of the three, the free shipping threshold is the lowest-effort, highest-conversion tactic available to most DTC brands.
What AOV doesn't tell you: margin. A $120 AOV on low-margin commodity products can be worth less than a $60 AOV on high-margin consumables. AOV is only meaningful in the context of gross margin, which is why LTV must be margin-adjusted.
Customer Lifetime Value (LTV)
LTV is defined as the total gross profit a business expects to generate from a single customer over the entire duration of their relationship.
The common mistake is calculating revenue LTV, total spend, not profit. That number is flattering and useless. Gross margin must be in the formula.
LTV = AOV × Purchase Frequency (per year) × Gross Margin % × Customer Lifespan (years)
If your AOV is $85, customers purchase 3 times per year, your gross margin is 45%, and the average customer stays for 2 years:
LTV = $85 × 3 × 0.45 × 2 = $229.50
The gross margin multiplier is the number most founders omit. Without it, you're calculating revenue per customer, not value per customer. A DTC brand with 30% gross margins and $300 revenue LTV has a true LTV of $90. That changes every acquisition decision you make.
Customer Acquisition Cost (CAC)
CAC is defined as the total cost of sales and marketing required to acquire one new paying customer.
CAC = Total Acquisition Spend / New Customers Acquired
What to include: paid social spend, search ads, influencer fees, agency retainers, promo codes and discounts used to drive first purchase, and the fully loaded cost of any sales or marketing headcount focused on acquisition.
What to exclude: retention marketing spend (email, loyalty programs), customer success costs, and brand-level spend that doesn't directly drive conversion. Mixing retention spend into CAC inflates the number and misrepresents your acquisition efficiency.
If you spent $19,000 on acquisition last month and acquired 500 new customers, your CAC is $38.
How AOV, CAC, and LTV Connect
The LTV:CAC ratio measures how much value a customer generates relative to what it cost to acquire them, the master metric for e-commerce business model viability.
LTV:CAC Ratio = LTV / CAC
What the ratio means in practice:
- Below 1:1, you are destroying value with every customer acquired. Growth accelerates the problem.
- 1:1 to 3:1, marginal or early-stage. You're covering acquisition cost but leaving little for overhead, product, and profit.
- 3:1, the widely cited benchmark for a healthy e-commerce business. For every $1 spent acquiring a customer, you generate $3 in gross profit.
- Above 5:1, strong unit economics, but may indicate underinvestment in acquisition. If your ratio is very high, you may be able to grow faster by spending more.
CAC payback period is the companion metric, how many months until a customer has generated enough gross profit to cover their acquisition cost.
CAC Payback Period (months) = CAC / (AOV × Gross Margin % × Purchase Frequency per month)
For subscription e-commerce, target under 6 months. For DTC with infrequent purchase cycles, under 12 months is acceptable. Above 18 months puts serious strain on working capital.

How to Calculate Your LTV:CAC Ratio (Step-by-Step)
Calculate your LTV:CAC ratio by building each metric from first principles, AOV first, then LTV with gross margin applied, then CAC, and dividing the result.
Worked example, Acme Commerce: Acme is a DTC skincare brand. Here are the inputs:
- Monthly revenue: $127,500
- Monthly orders: 1,500
- Annual purchase frequency per customer: 3.5 orders/year
- Gross margin: 48%
- Average customer lifespan: 2.5 years
- Monthly acquisition spend: $28,000
- New customers acquired this month: 620
Step 1, Calculate AOV:
AOV = $127,500 / 1,500 = $85
Step 2, Calculate margin-adjusted LTV:
LTV = $85 × 3.5 × 0.48 × 2.5 = $357
Step 3, Calculate CAC:
CAC = $28,000 / 620 = $45.16
Step 4, Calculate LTV:CAC ratio:
LTV:CAC = $357 / $45.16 = 7.9x
Step 5, Calculate CAC payback period:
CAC Payback = $45.16 / ($85 × 0.48 × 3.5/12) = $45.16 / $11.90 = 3.8 months
Acme's unit economics are strong, 7.9x LTV:CAC and a 3.8-month payback period. With those numbers, aggressive reinvestment in acquisition is justified. A ratio above 5x with a sub-6-month payback is the profile of a business that can scale spend safely.
E-commerce LTV:CAC Ratio Calculator
Enter your key e-commerce metrics to calculate your margin-adjusted LTV:CAC ratio and see whether your unit economics support aggressive growth.
E-commerce Unit Economics Benchmarks
A healthy LTV:CAC ratio for a DTC e-commerce brand is 3:1 or above. Below 1.5:1 at scale is a structural problem that marketing efficiency alone cannot fix.
| Segment | Strong LTV:CAC | Acceptable | Warning | CAC Payback Target |
|---|---|---|---|---|
| DTC brand (consumables) | > 4x | 2.5–4x | < 2x | < 8 months |
| DTC brand (durables) | > 3x | 2–3x | < 1.5x | < 12 months |
| Subscription box | > 3x | 2–3x | < 2x | < 6 months |
| Marketplace seller | > 2.5x | 1.5–2.5x | < 1.5x | < 9 months |
| Commodity e-commerce | > 2x | 1.5–2x | < 1x | < 6 months |
Two segment-specific notes. Subscription box businesses carry higher churn risk than DTC repeat-purchase models, the CAC payback target is tighter because churned subscribers rarely reactivate. Durables (furniture, electronics, high-ticket items) tolerate longer payback periods because average order values are higher and purchase frequency is structurally lower, the economics work on fewer, larger transactions.
4 Ways to Improve Your Unit Economics Without Increasing Ad Spend
Most unit economics advice defaults to "optimize your ad targeting" or "reduce your CPMs." Those levers matter, but they're also the ones every competitor is pulling simultaneously. The higher-leverage moves are structural, and most DTC brands underinvest in them.
1. Raise AOV via bundling and shipping thresholds. Bundles increase AOV by 15–30% in most DTC categories without requiring additional traffic. The mechanism is simple: a customer considering one product at $45 will often convert on a bundle at $79 if the discount feels meaningful. Set your free shipping threshold 18–20% above your current AOV and communicate it clearly in the cart. Both tactics require zero incremental ad spend.
2. Extend customer lifespan via post-purchase sequencing. The 30 days after a first purchase are the highest-leverage retention window in e-commerce. A post-purchase email sequence, order confirmation, delivery notification, product education, cross-sell at day 14, replenishment prompt at day 21, can increase second-purchase rate by 20–35% without touching your acquisition budget. Second-purchase rate is the single best predictor of long-term LTV in DTC.
3. Improve gross margin via COGS negotiation and SKU rationalization. A 5-percentage-point improvement in gross margin has the same effect on LTV as a 5-point increase in purchase frequency, but it compounds across your entire customer base instantly. Audit your bottom 20% of SKUs by margin contribution. Products that drive high order volume at thin margins often hurt unit economics more than they help. Rationalize your SKU count before you optimize your ad account.
4. Reduce blended CAC via channel mix. Paid social CAC is visible and easy to measure, which is why most brands over-index on it. Organic search, referral programs, and owned community channels typically produce CAC 40–70% below paid acquisition, but require 6–12 months of investment before they scale. Brands that build a meaningful organic and referral mix before Series A have structurally better unit economics than those that don't, independent of how well they manage their paid channels.
Common Unit Economics Mistakes
1. Using revenue LTV instead of margin-adjusted LTV. Revenue LTV, total customer spend without accounting for COGS, overstates the true value of a customer by the inverse of your gross margin. At 40% gross margins, your revenue LTV is 2.5× your actual LTV. Every acquisition decision made on revenue LTV is systematically overestimating how much you can afford to spend on CAC.
2. Measuring CAC at the blended level only. Blended CAC (total acquisition spend divided by all new customers) hides the performance difference between channels. A blended CAC of $38 can mask a paid social CAC of $65 and an organic CAC of $12, and those two numbers require completely different strategic responses. Always decompose CAC by channel before making budget allocation decisions.
3. Excluding COGS and fulfillment from gross margin. Gross margin in the LTV formula should reflect the true cost of delivering the product, including COGS, shipping, packaging, and returns processing. Brands that use top-line revenue margin (excluding fulfillment costs) consistently overstate LTV and underprice their customer acquisition ceiling. Include every variable cost that scales with orders before finalizing your gross margin input.
Key Takeaways
- E-commerce LTV formula: AOV × Purchase Frequency × Gross Margin % × Customer Lifespan, gross margin must be included; revenue LTV overstates true customer value by the inverse of your margin
- 3:1 LTV:CAC is the minimum viable benchmark for a healthy DTC brand; below 1.5:1 at scale is a structural problem ads cannot fix
- CAC payback period is the companion to LTV:CAC, target under 8 months for consumable DTC, under 12 months for durables; above 18 months strains working capital
- AOV is the most actionable short-term lever, free shipping thresholds set 18–20% above current AOV and product bundling can lift AOV 15–30% with zero incremental ad spend
- Post-purchase sequencing in the first 30 days is the highest-leverage retention investment in e-commerce, second-purchase rate is the single best predictor of long-term LTV
- Blended CAC hides channel-level reality, always decompose by channel before making budget allocation decisions
Improving unit economics is ultimately a compounding game, small improvements in AOV, gross margin, and customer lifespan multiply against each other in the LTV formula. For subscription e-commerce businesses, the dynamic is even more pronounced: understand how churn rate directly compresses LTV and why reducing monthly churn by even 1 percentage point can be worth more than doubling your acquisition budget. Revenue Map's e-commerce financial model lets you adjust AOV, CAC, gross margin, and purchase frequency in a single model, and see exactly how each lever moves your LTV:CAC ratio and payback period in real time. You can also calculate each input on its own: AOV, ROAS, repeat purchase rate, and the LTV:CAC ratio. And if you are still choosing a business model, a full startup financial model puts these order-level numbers in the context of fixed costs, break-even, and runway.
Sources
The unit-economics benchmarks in this guide, LTV:CAC targets, CAC payback windows, AOV lift ranges, and repeat-purchase rates, reflect figures published in the following sources. Specific figures should be read as representative industry ranges that vary by category, price point, and channel mix.
- Shopify Commerce Trends & Benchmarks, DTC conversion, AOV, and retention benchmarks
- Klaviyo Marketing Benchmarks, e-commerce email/retention and repeat-purchase benchmarks
- Recharge State of Subscription Commerce, subscription e-commerce retention and LTV benchmarks
- Baymard Institute, Cart Abandonment Research, checkout conversion and abandonment benchmarks affecting CAC
Related Articles
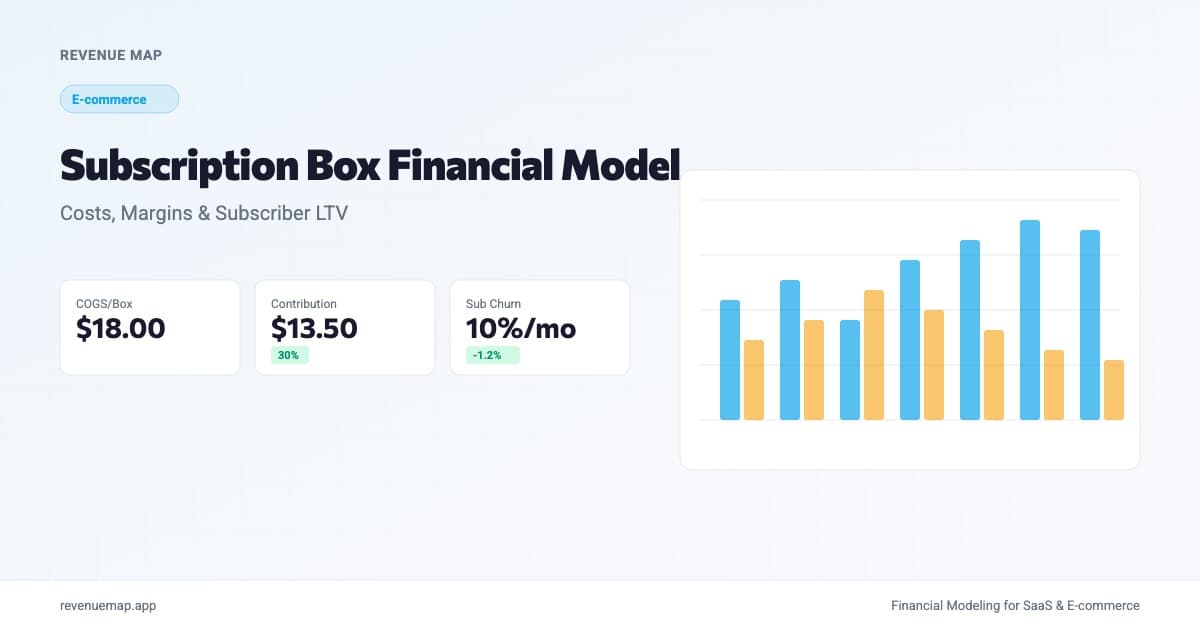
Subscription Box Financial Model: Costs, Margins, and LTV
Build a subscription box financial model with COGS, fulfillment, and churn formulas. Includes benchmarks and a contribution margin calculator.

FoodTech Unit Economics: Per-Order Profitability, Delivery Costs, and Break-Even Analysis
Learn how to calculate per-order profitability for food delivery businesses. Break down AOV, food costs, delivery expenses, and platform fees to find your true contribution margin and break-even point.
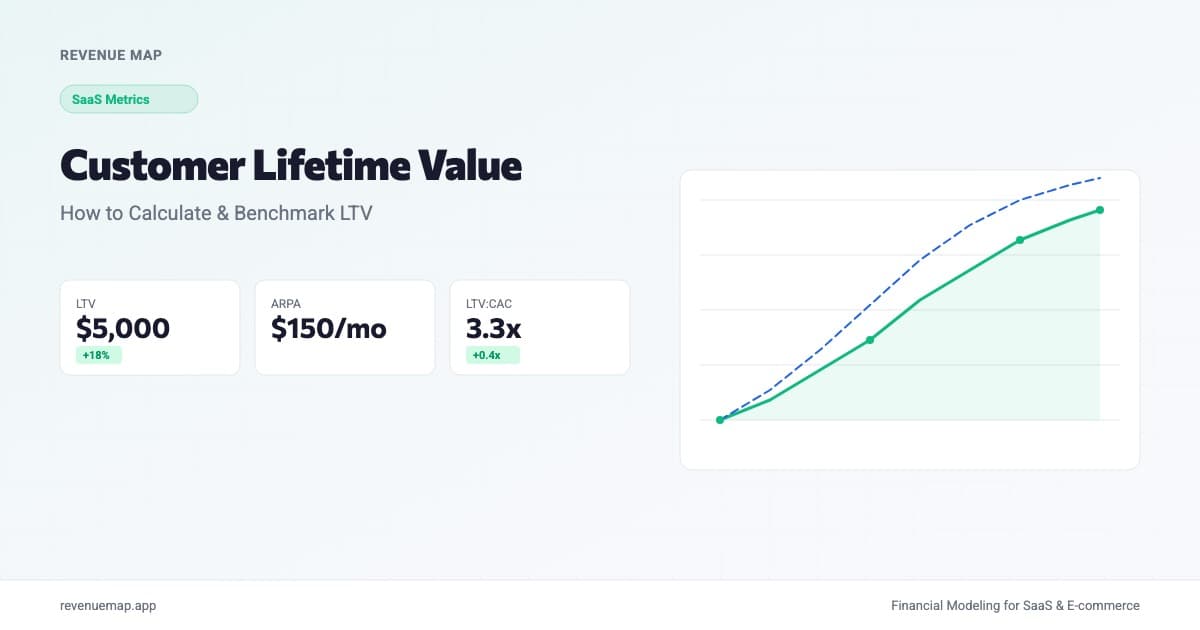
Customer Lifetime Value: How to Calculate LTV
Learn how to calculate customer lifetime value (LTV) with formulas, benchmarks by segment, and strategies to increase it for SaaS and e-commerce.