Financial Model Template: What Every Startup Needs
A financial model template is a pre-built framework that organizes your startup's revenue, costs, and cash flow into a testable plan. The five core tabs are assumptions, revenue, costs, profit and loss, and cash flow.
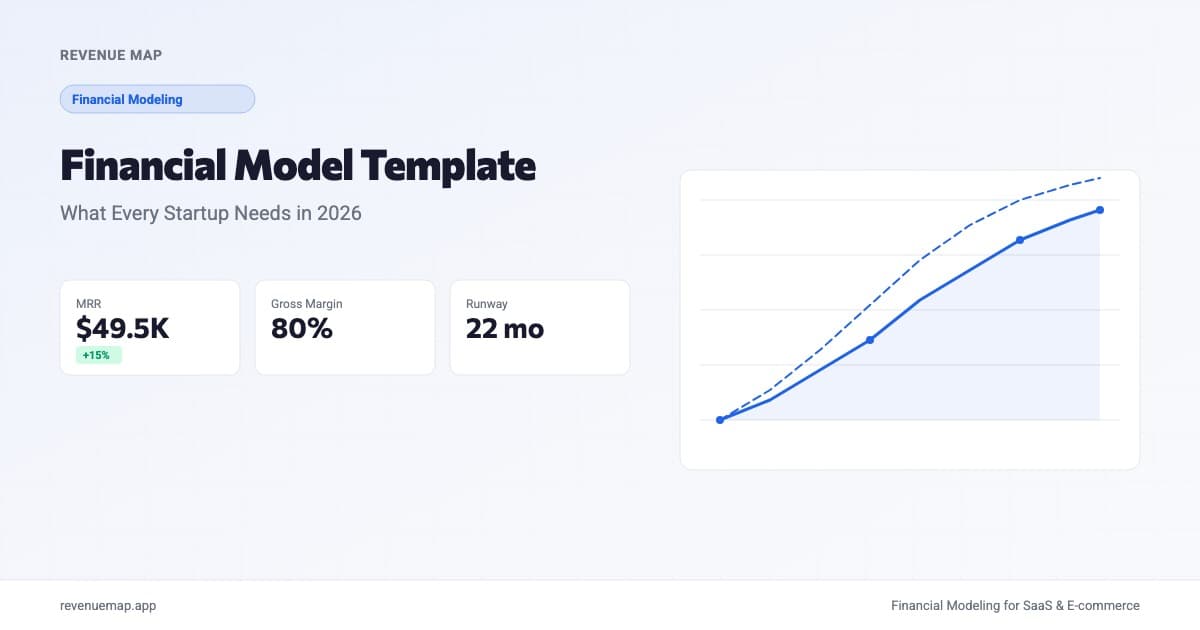
A financial model template is a pre-built framework that organizes your startup's revenue assumptions, cost structure, and cash flow projections into a single, testable plan. The right template gives you a working model in hours instead of weeks. The wrong one locks you into assumptions that don't match your business.
Getting this right matters more than most founders realize. SaaStr recently argued that many SaaS companies are failing not because AI is disrupting them, but because of basic operational mistakes: mispriced products, bloated cost structures, and a failure to model their own economics. A solid financial model template forces you to confront these questions before they become existential.
What Should a Financial Model Template Include?
Every financial model template needs to cover five areas: revenue projections, cost structure, profit and loss, cash flow, and assumptions. The assumptions tab is the one most templates get wrong. It should be the single location where every input variable lives: growth rates, pricing, hiring timelines, churn estimates, and cost-per-unit figures. When assumptions are scattered across tabs, scenario analysis becomes impossible.
For SaaS startups, the template also needs to handle MRR components (new, expansion, contraction, and churned revenue). For e-commerce businesses, it needs order volume, AOV, and fulfillment costs per unit. The business model dictates the template structure, which is why generic one-size-fits-all financial models rarely work well.
The Five Core Tabs of a Startup Financial Model
1. Assumptions
This is the control panel of your model. Every variable that might change goes here: customer growth rate, ARPU, churn rate, headcount plan, and infrastructure cost per user. Wire every other tab to reference this sheet. When an investor asks "what happens if churn doubles?" you should be able to change one cell and watch the entire model update.
2. Revenue
Build this tab around your pricing model. SaaS companies should model MRR bottom-up: starting customers multiplied by ARPU, plus new customer additions, minus churned revenue, plus expansion revenue. E-commerce businesses model revenue as traffic multiplied by conversion rate multiplied by AOV.
Monthly Revenue = Starting Customers × ARPU + New Customers × ARPU - Churned Customers × ARPU
The best templates include both a monthly view (for the next 18-24 months) and a quarterly or annual roll-up for investor presentations.
3. Costs
Split costs into three categories:
- COGS: everything directly tied to serving a customer (hosting, payment processing, support labor)
- Operating expenses: engineering salaries, sales, marketing, G&A
- One-time costs: incorporation fees, equipment purchases, initial development
Map headcount by month. Salaries plus benefits (typically 1.25x to 1.3x base salary) usually account for 60-80% of a startup's total cost structure.
4. Profit and Loss (P&L)
This is the output tab. It pulls revenue from the revenue tab and costs from the costs tab to calculate three numbers:
Gross Profit = Revenue - COGS
Operating Income = Gross Profit - Operating Expenses
Net Income = Operating Income - Taxes - Interest
Your gross margin percentage is one of the first metrics investors check. SaaS companies typically target 70-85%. If your template shows margins below 60%, revisit your COGS assumptions.
5. Cash Flow
Revenue is not cash. For SaaS companies with annual contracts, the timing difference between recognizing revenue and actually receiving payment can make or break your runway. The cash flow tab tracks accounts receivable, accounts payable, and actual cash balance month by month. This is the tab that tells you when you run out of money, which matters far more than when your P&L turns positive.
How to Build Your Financial Model: Step by Step
Step 1: Start with Your Assumptions
List every driver of your business. For a B2B SaaS startup, that typically includes starting customer count, monthly new customer additions, churn rate, ARPU, headcount by month, fully-loaded salary cost, infrastructure cost per customer, and marketing spend as a percentage of revenue.
Don't guess at these numbers. Pull them from your actual data if you have it, or from industry benchmarks if you're pre-revenue. SaaS growth rate benchmarks and burn rate data provide realistic ranges to start with.
Step 2: Build Revenue Bottom-Up
Top-down revenue forecasts ("the market is $10B and we'll capture 1%") belong in pitch decks, not financial models. Build bottom-up from customers multiplied by price. For each month, calculate:
- Starting customers from the previous month
- Plus new customers acquired
- Minus customers lost to churn
- Equals ending customers
- Multiplied by ARPU equals monthly revenue
This approach ties your revenue directly to acquisition and retention metrics, which makes the model testable against real performance. If your CAC payback period is 12 months, that constraint should flow through the model automatically.
Step 3: Map Your Cost Structure Honestly
The most common failure mode in startup financial models is underestimating costs. Here's what founders typically miss:
| Cost Category | What Gets Forgotten |
|---|---|
| Salaries | Benefits (add 25-30%), payroll taxes, recruiting fees |
| Infrastructure | Scaling costs as the user base grows past free-tier limits |
| Marketing | Attribution gaps, agency fees, wasted ad spend |
| G&A | Legal retainers, accounting, insurance, office tools |
| Tools and Software | The 15-30 SaaS subscriptions every startup accumulates |
Step 4: Connect Everything to P&L and Cash Flow
Once revenue and costs are wired up, the P&L and cash flow tabs are mostly formulas. The key design decision: model monthly for the first 18-24 months, then switch to quarterly. Monthly granularity matters when you're managing burn rate closely. Beyond two years out, quarterly resolution is sufficient and keeps the model manageable.
Calculate Your Monthly P&L
Startup P&L Calculator
Estimate your monthly net income from key inputs
Financial Model Template Benchmarks by Stage
The level of detail your template needs depends entirely on where you are. Pre-seed models that try to forecast five years of monthly data are wasting effort. Series B models without departmental budgets are missing critical detail.
| Stage | Forecast Horizon | Revenue Detail | Cost Detail | Scenarios |
|---|---|---|---|---|
| Pre-seed | 18-24 months | Top-line MRR | 5-8 line items | 2 (base, downside) |
| Seed | 24-36 months | MRR by cohort | Departmental | 3 (base, up, down) |
| Series A | 36-48 months | MRR by segment and cohort | Full headcount plan | 3+ with sensitivity |
| Series B+ | 48-60 months | Product-line P&L | Full OpEx budget | Monte Carlo optional |
One thing we've noticed: the models that actually get used are the ones that stay simple enough to update weekly. If your template takes more than 30 minutes to refresh with actuals, it's too complex for your current stage.
Common Mistakes in Financial Model Templates
-
Hardcoded numbers instead of linked assumptions. If your revenue formula contains the number 500 instead of a reference to a cell in your assumptions tab, you'll lose track of what drives what. Every variable that can change should be parameterized.
-
Missing the cash timing gap. Your P&L might show profitability at month 14. But if 60% of your revenue comes from annual contracts billed upfront, your cash position tells a completely different story. Always model when money actually moves, not just when it's recognized.
-
Flat cost assumptions. Hosting costs don't stay at $2,000/month when you grow from 100 to 10,000 users. Build step functions into your cost model: expenses that stay flat until a threshold, then jump. This matters most for infrastructure and support headcount.
-
No scenario analysis. A single-scenario model is a wish, not a plan. At minimum, build a base case and a downside case. The downside should assume 50% of your target growth rate and 1.5x your expected churn. If your startup survives the downside scenario, you have a real break-even path.
Key Takeaways
- A financial model template should have five tabs: assumptions, revenue, costs, P&L, and cash flow. The assumptions tab is the most important because it controls every other output.
- Build revenue bottom-up from customers multiplied by price, never top-down from market size. Bottom-up models are testable. Top-down models are aspirational.
- Underestimating costs is the most common template mistake. Include benefits, scaling infrastructure, and the SaaS tools your team actually uses.
- Match your template's complexity to your stage. Pre-seed needs 18 months and 8 line items. Series A needs 36 months and a full headcount plan.
- Always include at least two scenarios. If the downside case kills the company within your current runway, you need to rethink the plan before fundraising.
Ready to skip the spreadsheet setup? Build your financial model with Revenue Map and get a working template customized to your business in minutes.
Related Articles
Budget vs Forecast vs Projection for Startups
Budgets, forecasts, and projections serve different purposes. Learn when to use each and how they connect in your startup financial plan.
Financial Modeling Software for Startups (2026)
Compare the best financial modeling software for startups, from spreadsheets to AI-native tools. Features, pricing, and when to upgrade from Excel.
Creating Financial Models in Excel for Startups
Step-by-step guide to building a startup financial model in Excel. Covers revenue, expenses, cash flow, and scenario analysis with formulas and examples.