LTV to CAC Ratio: How to Calculate and Benchmark It
The LTV to CAC ratio compares customer lifetime value to acquisition cost. A healthy SaaS company targets a ratio of 3 to 1 or higher, meaning each customer generates three dollars in lifetime revenue for every dollar spent acquiring them.
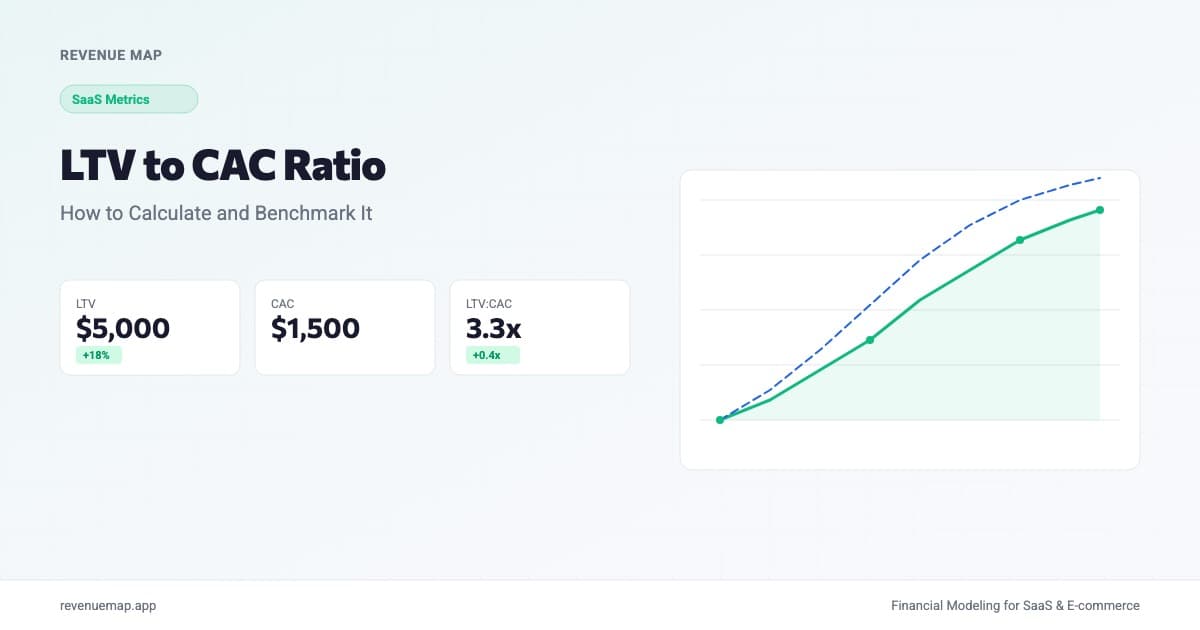
The LTV to CAC ratio measures how much lifetime revenue a customer generates for every dollar you spend acquiring them. A ratio of 3:1 means each customer returns three dollars over their lifetime for every dollar of acquisition cost, and it is the single most important unit economics metric for any subscription or recurring-revenue business. If you only track one number to judge whether your growth spending is working, this is the one.
That ratio matters more than ever as capital efficiency becomes the defining trait of fundable companies. SaaStr recently highlighted Palantir's latest quarter: 93% year-over-year growth at $7.7 billion in ARR, with 157% net revenue retention and 47% GAAP operating margins. Those numbers translate into an extraordinarily high implied LTV/CAC ratio because their existing customers expand so aggressively that lifetime value keeps climbing without additional acquisition spend. Most startups won't reach Palantir's scale, but the principle is the same at every stage: the higher your LTV/CAC ratio, the more efficiently your growth compounds.
What Is the LTV/CAC Ratio?
The LTV/CAC ratio is the quotient of customer lifetime value (LTV) divided by customer acquisition cost (CAC). It answers a simple question: for every dollar you spend to win a new customer, how many dollars does that customer generate before they leave?
The metric connects two sides of the business. LTV captures your product's ability to retain customers and grow their spending over time. CAC captures the efficiency of your sales and marketing machine. Together, they reveal whether your growth engine is self-sustaining or slowly draining your bank account.
A few things make this metric especially useful for founders. First, it works across business models. SaaS, e-commerce subscriptions, marketplaces with recurring sellers: any business with a repeating revenue relationship can calculate it. Second, it translates directly into fundraising conversations. Investors use LTV/CAC as shorthand for "does this company have a viable path to profitability?" A strong ratio doesn't guarantee a term sheet, but a weak one almost guarantees you won't get one.
How to Calculate LTV/CAC Ratio
The formula has two components:
LTV/CAC Ratio = Customer Lifetime Value / Customer Acquisition Cost
You need to calculate each input separately.
Customer Lifetime Value (LTV)
The simplest formula for subscription businesses:
LTV = ARPA / Monthly Churn Rate
Where ARPA is average revenue per account per month. For a deeper breakdown of LTV methods (including cohort-based and gross-margin-adjusted approaches), see our full guide to customer lifetime value calculation.
Worked example: Your SaaS product charges an average of $150 per month, and your monthly logo churn rate is 3%.
LTV = $150 / 0.03 = $5,000
Customer Acquisition Cost (CAC)
CAC = Total Sales & Marketing Spend / New Customers Acquired
Include everything: ad spend, sales team salaries and commissions, marketing tools, content production costs, and any other expense that exists primarily to acquire new customers. The period should match: if you're calculating quarterly CAC, use quarterly spend and quarterly new customers.
Worked example: You spent $120,000 on sales and marketing last quarter and acquired 80 new customers.
CAC = $120,000 / 80 = $1,500
Putting It Together
LTV/CAC Ratio = $5,000 / $1,500 = 3.3x
A 3.3x ratio means each customer generates $3.30 of lifetime value for every $1 of acquisition cost. That sits right in the healthy range for most SaaS companies.
Calculate Your LTV/CAC Ratio
LTV/CAC Ratio Calculator
Calculate your ratio from ARPA, churn rate, and CAC
What Is a Good LTV/CAC Ratio?
The widely cited benchmark is 3:1, but the right target depends on your stage, business model, and how you plan to grow.
| LTV/CAC Range | What It Signals | Action |
|---|---|---|
| Below 1:1 | Losing money on every customer | Stop spending on paid acquisition immediately and fix retention or pricing |
| 1:1 to 3:1 | Viable but inefficient | Reduce CAC through channel optimization or increase LTV through upsells and retention |
| 3:1 to 5:1 | Healthy and fundable | Maintain current efficiency while scaling spend |
| Above 5:1 | Possibly underinvesting | Consider increasing marketing budget to capture more market share |
That said, context matters. A company with a 2:1 ratio and 6-month CAC payback period might be in better shape than one with a 4:1 ratio but 18-month payback. The ratio tells you about lifetime economics, but it doesn't tell you when you'll see the cash. Pair it with CAC payback to get the full picture.
The Palantir example is instructive here. Their 157% net revenue retention means the average customer's value grows 57% each year without any additional acquisition cost. That inflates the numerator (LTV) dramatically while keeping the denominator (CAC) constant for existing accounts. Even if their new-customer CAC is high, the expansion revenue makes the lifetime ratio exceptional. For most SaaS businesses, NRR between 100% and 120% is realistic, and that expansion component is often the biggest lever for improving LTV/CAC.
LTV/CAC Ratio by Acquisition Channel
One of the most common mistakes founders make is only tracking a blended LTV/CAC ratio across all channels. The blended number can hide serious problems.
| Channel | Typical CAC Range | Typical LTV/CAC | Notes |
|---|---|---|---|
| Organic search / content | $50-$400 | 6:1 to 10:1 | Low CAC but slow to scale |
| Paid search (Google Ads) | $500-$2,000 | 2:1 to 4:1 | Fastest to scale but competitive |
| Outbound sales (SDR team) | $2,000-$8,000 | 3:1 to 6:1 | Higher CAC offset by larger deal sizes |
| Product-led growth / referral | $20-$200 | 8:1 to 15:1 | Best unit economics but requires product fit |
| Paid social (LinkedIn, Meta) | $300-$1,500 | 1.5:1 to 3:1 | Often lowest ratio, watch closely |
Here's the thing: if your paid social channel has a 1.5:1 ratio but organic has 10:1, a blended 4:1 looks healthy while you're actually destroying value on every paid dollar. Segment the ratio by channel at least monthly. Kill channels consistently below 2:1 and reinvest in channels above 5:1. This is where unit economics move from a reporting metric to an actual decision-making tool.
Common Mistakes That Make the Ratio Lie
1. Using gross revenue instead of gross-margin-adjusted LTV. If your gross margin is 60%, your real LTV is 60% of the simple ARPA-divided-by-churn calculation. Companies with heavy infrastructure costs (AI inference, data processing, logistics) need to use the margin-adjusted version or their ratio will look 40% to 50% better than reality.
2. Ignoring cohort differences. Customers acquired through a free trial convert differently than those acquired through enterprise sales. Their churn profiles differ, their expansion rates differ, and their LTV differs. A single blended LTV number mixes these cohorts and produces a figure that doesn't describe any actual customer segment accurately.
3. Underloading CAC. Some founders exclude sales salaries, event sponsorships, or content production costs from their CAC calculation. If an expense exists primarily to attract new customers, it belongs in the denominator. Underloading CAC artificially inflates the ratio and leads to overconfidence in channels that aren't actually profitable.
4. Calculating LTV too early. If your company is 12 months old, you don't have enough churn data to calculate a reliable LTV. Early cohorts often look stickier than they really are because you haven't hit the natural churn plateau yet. Use a capped LTV (for example, 24-month or 36-month value) until you have at least two years of retention data.
How to Improve a Low LTV/CAC Ratio
You can improve the ratio from either side: increase LTV or decrease CAC. In practice, the highest-leverage moves usually come from the LTV side.
Reduce churn. Every percentage point of monthly churn reduction has an outsized impact on LTV. Dropping from 5% to 4% monthly churn increases LTV by 25%. Prioritize onboarding, usage monitoring, and proactive outreach to at-risk accounts. See our guide to churn rate calculation for frameworks.
Expand existing accounts. Upsells, cross-sells, and usage-based pricing tiers increase ARPA without touching CAC. This is the Palantir playbook: their 157% NRR means they grow revenue from existing customers faster than they lose it to churn, compounding the LTV of every cohort.
Optimize channel mix. Shift spend from low-ratio channels (typically paid social) toward high-ratio channels (organic, referral, product-led). The tradeoff is speed: organic scales slowly, so this works best as a gradual rebalancing, not a sudden pivot.
Raise prices. If your product delivers real value, test a price increase. A 20% ARPA increase flows directly to LTV with no effect on CAC. Many founders underprice for years because they fear churn, but well-executed pricing changes typically cause minimal cancellations.
Key Takeaways
- LTV/CAC ratio = Customer Lifetime Value / Customer Acquisition Cost, and the standard SaaS benchmark is 3:1 or higher
- Always segment by channel and cohort, because blended ratios hide money-losing acquisition channels behind profitable organic traffic
- NRR is the biggest lever for improving the ratio, since expansion revenue increases LTV without adding acquisition cost. Palantir's 157% NRR at $7.7B ARR demonstrates this at scale
- Pair LTV/CAC with CAC payback period for a complete picture: the ratio shows lifetime return, payback shows cash flow timing
- Use gross-margin-adjusted LTV if your margins fall below 70%, or the ratio will overstate your true economics
The LTV/CAC ratio should inform every growth decision you make: which channels to scale, when to raise prices, whether a new market is worth entering. Build your financial model in Revenue Map to see how changes in churn, ARPA, and marketing spend affect your ratio across scenarios, and track it automatically as your business grows.
Related Articles
SaaS Unit Economics: Formulas and Benchmarks (2026)
Calculate SaaS unit economics with formulas for CAC, LTV, contribution margin, and payback. Includes 2026 benchmarks by stage and a free calculator.
Customer Lifetime Value: How to Calculate LTV
Learn how to calculate customer lifetime value (LTV) with formulas, benchmarks by segment, and strategies to increase it for SaaS and e-commerce.
CAC Payback Period: How to Calculate and Benchmark It
Learn how to calculate your CAC payback period, see 2026 benchmarks by company stage, and find strategies to shorten it.