Ice Cream Truck Business Plan: Costs and Numbers
An ice cream truck business plan should include startup costs of $20,000 to $100,000, seasonal revenue projections built from daily customers times average ticket, and a 12-month cash flow forecast that accounts for off-season months. Lenders expect a debt service coverage ratio of 1.25x or higher.
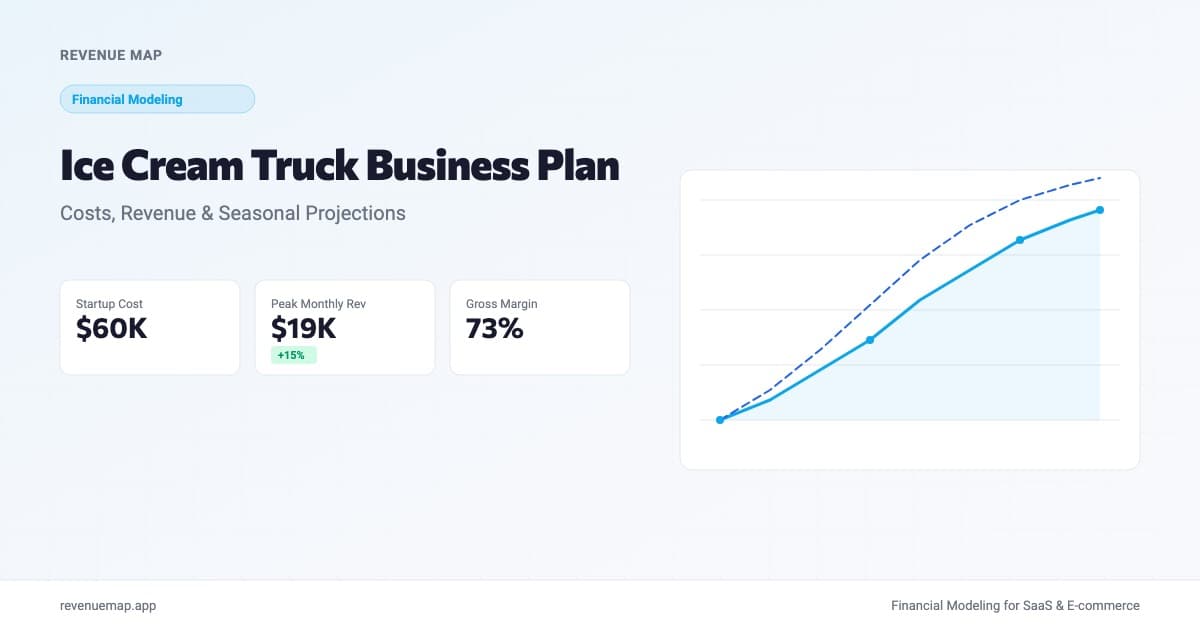
An ice cream truck business plan needs a financial section that proves you can cover your costs year-round, not just during the busy summer months. Lenders approve ice cream truck loans based on projected revenue, a clear startup cost breakdown, and evidence that the business can service its debt even when daily sales drop in the colder months. The concept is simple. The seasonal math is the part that trips people up.
That's worth noting because franchise models are getting renewed attention for their revenue potential. A recent look at top revenue franchises highlights the appeal of buying into a proven system. But franchise fees alone can run $25,000 to $50,000 before you even buy the truck. An independent ice cream truck lets you skip that fee entirely, control your product mix, and launch for less total capital. The tradeoff: you need tighter financial projections because there's no franchisor guaranteeing your unit economics.
Here is how to build the financial section of your ice cream truck business plan with the numbers lenders actually review.
How Much Does It Cost to Start an Ice Cream Truck?
Startup costs for an ice cream truck range from about $20,000 for a used vehicle with basic equipment to $100,000 for a new custom build with a commercial-grade soft-serve setup. Most first-time operators land in the $35,000 to $65,000 range.
Here is a realistic breakdown:
| Category | Low Estimate | Mid Estimate | High Estimate |
|---|---|---|---|
| Truck (used vs. new) | $8,000 | $25,000 | $55,000 |
| Freezer and refrigeration equipment | $3,000 | $8,000 | $18,000 |
| Soft-serve machine (optional) | $0 | $5,000 | $12,000 |
| Generator or electrical system | $1,500 | $3,000 | $6,000 |
| Wraps, signage, and speaker system | $1,000 | $3,000 | $6,000 |
| Initial inventory (30 days) | $800 | $1,500 | $3,000 |
| Permits, licenses, and health inspection | $1,000 | $2,500 | $5,000 |
| Insurance (first year) | $2,000 | $3,500 | $6,000 |
| POS system and payment processing | $300 | $800 | $1,500 |
| Working capital (3 months) | $3,000 | $8,000 | $15,000 |
| Total | $20,600 | $60,300 | $127,500 |
The working capital line is especially important for seasonal businesses. If you launch in April, you will have strong sales through August, but September through March may generate half the daily volume or less. A plan that shows zero cash reserve after the truck is built out is a red flag for any lender.
One decision that shapes the entire budget: pre-packaged novelties versus soft serve. A novelty-only truck (popsicles, ice cream bars, cups) needs only chest freezers and skips the $5,000 to $12,000 soft-serve machine entirely. Soft serve commands higher average tickets but adds equipment cost, maintenance, and daily cleaning time. Most operators start with novelties and add soft serve in year two once the route is proven.
For a side-by-side comparison of mobile food business costs, the food truck business plan covers the broader category. Ice cream trucks typically cost 40% to 60% less because the kitchen equipment list is far simpler.
How to Project Ice Cream Truck Revenue
Revenue for an ice cream truck depends on three inputs: daily customer count, average ticket, and operating days per month. The formula:
Monthly Revenue = Daily Customers x Avg Ticket x Days Open
The honest challenge is that all three inputs shift with the season. Here is what the numbers look like across different scenarios:
| Scenario | Avg Ticket | Daily Customers | Days/Month | Monthly Revenue |
|---|---|---|---|---|
| Peak summer, residential routes | $6 | 120 | 26 | $18,720 |
| Peak summer, events and festivals | $7 | 150 | 14 | $14,700 |
| Spring/fall shoulder season | $5.50 | 70 | 20 | $7,700 |
| Winter (warm-climate markets) | $5 | 50 | 16 | $4,000 |
| Winter (cold-climate, parked) | $0 | 0 | 0 | $0 |
A full-year operator in a warm-climate market like Texas, Florida, or Southern California can realistically project $120,000 to $180,000 in annual revenue. A seasonal operator in the Northeast or Midwest should plan for $60,000 to $100,000, all of it concentrated in five to seven months.
Here's the thing about lender math: they divide your annual debt payment by your annual net operating income. If your truck earns nothing for four months, those zeros still count in the denominator. That is why many seasonal ice cream truck operators pick up catering gigs, hot chocolate routes, or off-season event work to smooth the cash flow curve.
Ice Cream Truck Profit Margins
Ice cream trucks carry strong gross margins because the cost of goods sold is low relative to the selling price. A box of 24 ice cream bars might cost $8 wholesale and sell for $3 each, producing a per-unit margin above 85%. Soft serve is similar: a gallon of mix costs $4 to $6 and yields 20 to 25 servings at $4 to $6 each.
Blended across a typical product mix, expect these margins:
| Metric | Novelty-Only Truck | Soft-Serve Truck | Blended (Both) |
|---|---|---|---|
| Cost of goods sold | 25-30% | 20-28% | 22-30% |
| Gross margin | 70-75% | 72-80% | 70-78% |
| Fuel and vehicle costs | 6-10% | 6-10% | 6-10% |
| Labor (if hiring a driver) | 0-25% | 0-25% | 0-25% |
| Permits, insurance, overhead | 5-8% | 5-8% | 5-8% |
| Net margin (owner-operated) | 22-35% | 25-38% | 24-36% |
| Net margin (with hired driver) | 8-15% | 10-18% | 9-16% |
Owner-operated trucks keep the strongest margins because labor is the single largest expense after product cost. Adding a second truck with a hired driver cuts the per-truck margin but scales total profit. One common path is to prove the route yourself in year one, then hire a driver for that route and open a second one.
The comparison to brick-and-mortar is worth noting. A coffee shop or bakery typically nets 10% to 18% with much higher fixed costs. Ice cream trucks trade lower absolute revenue for higher percentage margins and far less capital at risk.
Calculate Your Ice Cream Truck Revenue
Ice Cream Truck Revenue Calculator
Estimate your monthly and annual ice cream truck revenue
Want to model this over 36 months with scenarios? Try Revenue Map free →
Adjust the operating months slider to reflect your market. A year-round operator in Miami might set it to 12. A seasonal operator in Chicago should use 5 to 7. The gap between those two scenarios is why lenders care so much about your cash flow forecast.
What Lenders Check in an Ice Cream Truck Business Plan
If you are financing your truck through an SBA loan or a bank, the financial section of your plan needs to answer four questions:
-
Startup cost breakdown with sources. Lenders want to see line items, not a single lump sum. Show quotes for the truck, equipment, and insurance. The startup cost calculator can help you organize this.
-
12-month cash flow forecast. This is the most scrutinized document for seasonal businesses. Show monthly revenue estimates that reflect seasonal variation, not a flat average. Your cumulative cash balance should never go negative after funding.
-
Break-even analysis. How many customers per day do you need to cover your fixed costs? For most ice cream trucks, the daily break-even sits between 30 and 60 customers depending on the cost structure. Run yours with the break-even calculator.
-
Debt service coverage ratio (DSCR). Lenders want a DSCR of 1.25x or higher, meaning your annual net operating income is at least 125% of your annual loan payments. For a $40,000 loan at 8% over five years (roughly $810/month in payments), you need at least $12,150 in annual net income above the payment amount.
DSCR = Annual Net Operating Income / Annual Debt Payments
The seasonal dip is where most ice cream truck plans get flagged. If your November-through-February revenue is zero and you still owe $810/month, the lender needs to see where that payment comes from. The answer is either savings from peak months, off-season income, or personal reserves. Spell it out.
Common Mistakes in Ice Cream Truck Financial Plans
-
Projecting summer revenue year-round. The fastest way to get a plan rejected. Use monthly estimates that reflect actual seasonal demand in your market. If you serve popsicles in Minnesota, January revenue is zero and your plan should say so.
-
Ignoring truck maintenance and repairs. A used truck will need repairs. Budget $2,000 to $5,000 annually for maintenance, more if the refrigeration unit is older. Breakdowns during peak season cost you both the repair bill and the lost sales.
-
Underestimating permit complexity. Some cities require separate permits for each neighborhood or park. Others restrict ice cream truck hours or routes entirely. Research your local requirements before building revenue projections around a route you cannot legally drive.
-
Skipping the off-season plan. Even if you park the truck for winter, you still have insurance, loan payments, and storage costs. Show how you cover those months or the plan has a hole.
Key Takeaways
- Ice cream truck startup costs range from $20,000 to $100,000, with most first-time operators spending $35,000 to $65,000
- Gross margins of 65% to 78% are typical, making ice cream trucks one of the highest-margin mobile food businesses
- Seasonality is the central financial risk: build your 12-month cash flow forecast with honest monthly estimates, not annual averages divided by twelve
- Lenders focus on the debt service coverage ratio, and for seasonal businesses they scrutinize the off-season months most closely
- Starting with pre-packaged novelties keeps equipment costs low and lets you add soft serve once the route is proven
The financial section is the part of the plan that gets your truck on the road. Run the numbers for your own ice cream truck, free, in about two minutes and see where your break-even lands before you start shopping for a truck.
Related Articles
Self Storage Business Plan: Costs and Projections
Build the financial section of your self storage business plan with real startup costs, revenue projections, and the numbers lenders require.
Nail Salon Business Plan: Costs and Projections
Build the financial section of your nail salon business plan with real startup costs, revenue projections, and cash flow forecasts lenders require.
Laundromat Business Plan: Costs and Projections
Build the financial section of your laundromat business plan with startup costs, revenue benchmarks, and the projections lenders expect.