Pitch Deck Financial Projections for Startups
Pitch deck financial projections are the slides in a fundraising deck that show investors your revenue forecast, cost structure, burn rate, and path to profitability. Most seed-stage decks need five financial slides: revenue projections, unit economics, burn and runway, use of funds, and key assumptions.
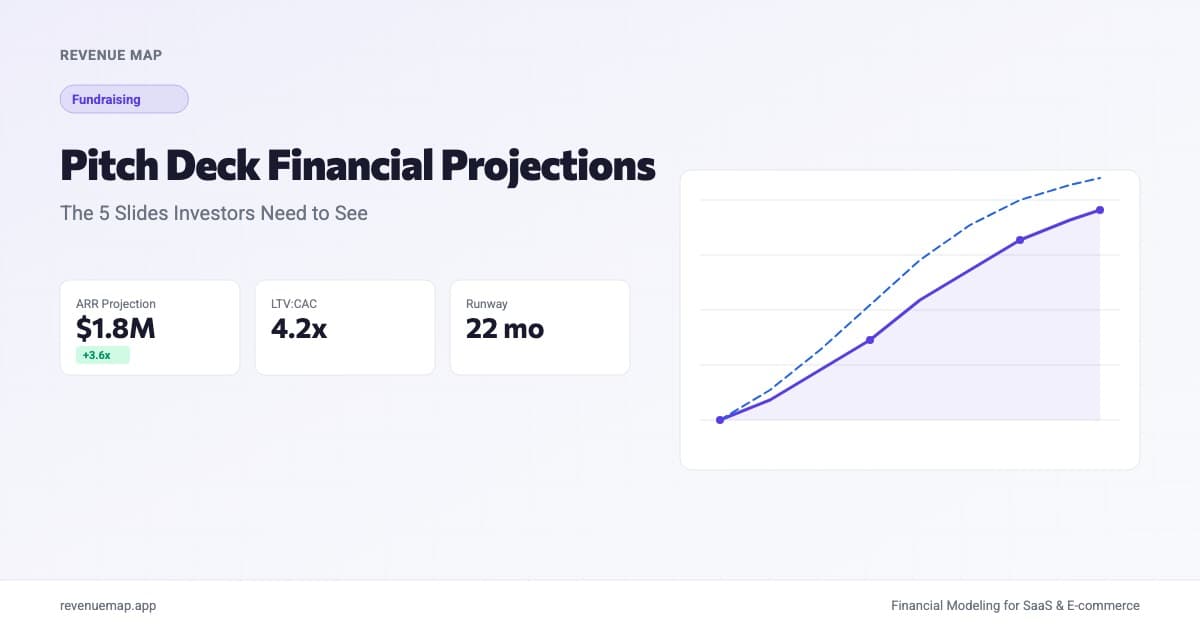
Pitch deck financial projections are the slides that show investors how your startup plans to make money, how fast it will grow, and when it will become profitable. They translate your business model into numbers that investors can evaluate, stress-test, and compare against benchmarks. If your financial slides are unclear or internally inconsistent, most investors will pass before reaching your product demo.
The bar for pitch deck financials is rising. SaaStr recently reported that board meetings increasingly involve AI tools reviewing financial materials ahead of time, parsing 30 slides of data that busy VCs used to skim. The implication for founders: your projections need to be structured clearly enough for both humans and machines to extract the key numbers in seconds. Sloppy formatting or buried assumptions won't survive that level of scrutiny.
What Are Pitch Deck Financial Projections?
Pitch deck financial projections are a set of forward-looking financial slides included in a fundraising presentation. They typically cover a 3-to-5-year window and translate your business strategy into quantified revenue, costs, and cash flow estimates.
Unlike a full financial model, which might have 20 tabs and hundreds of assumptions, pitch deck financials distill the story to five or six key slides. The goal isn't exhaustive detail. It's to demonstrate that you understand the economics of your business and have a credible path from where you are today to the outcome you're pitching.
The Five Financial Slides Every Pitch Deck Needs
1. Revenue Projections
This is the centerpiece. Show your expected monthly recurring revenue (or total revenue for non-subscription businesses) over a 3-year horizon. Month-by-month for year one, quarterly or annual after that.
Build it bottom-up, not top-down. "We'll capture 1% of a $50B market" tells investors nothing about execution. "We'll generate 300 leads per month, convert 4%, and close at $8,000 ACV" tells them exactly how the revenue arrives.
Monthly Revenue = New Customers × ARPA
Annual Revenue = Sum of Monthly Revenue + Expansion - Churn
For SaaS startups, frame growth in terms of MRR milestones. Seed-stage companies typically project 15 to 25% month-over-month growth, which translates to roughly 3x to 5x annual growth.
2. Unit Economics
Investors want proof that each customer is worth more than the cost to acquire them. The two numbers they'll look at first:
| Metric | What It Shows | Target |
|---|---|---|
| LTV:CAC Ratio | Lifetime value relative to acquisition cost | 3x or higher |
| CAC Payback | Months to recover acquisition cost | Under 12 months |
| Gross Margin | Revenue minus direct costs | 60% or higher for SaaS |
| Net Revenue Retention | Revenue growth from existing customers | 100% or higher |
If your LTV:CAC ratio is below 3x, you need to either reduce CAC or increase lifetime value before the math works at scale. Show investors you know which lever you're pulling.
3. Burn Rate and Runway
How much cash you spend per month and how long your current (or post-raise) cash lasts. This slide answers the question every investor silently asks: "Will this company run out of money before hitting the next milestone?"
Net Burn Rate = Monthly Revenue - Monthly Expenses
Runway (months) = Cash Balance / Net Burn Rate
Show both your current burn rate and your projected burn after deploying the capital you're raising. A typical seed-stage SaaS company burns $50K to $150K per month. Post-raise runway should be 18 to 24 months, giving you enough time to hit Series A milestones even if growth takes longer than expected.
4. Use of Funds
Break down how you'll allocate the capital you're raising. Investors aren't looking for a line-item budget. They want to see that spending maps to the growth drivers in your revenue model.
A clean breakdown looks like this:
| Category | % of Raise | Purpose |
|---|---|---|
| Engineering | 40-50% | Ship core product, reduce churn |
| Sales & Marketing | 25-35% | Scale proven acquisition channels |
| Operations & Infra | 10-15% | Support team, tooling, compliance |
| Buffer | 5-10% | Contingency for slower ramp |
The honest answer is that most startups spend 70% or more of their raise on people. That's fine. What matters is connecting the headcount plan to the revenue projections. If your model shows 5x revenue growth but your team stays flat, something doesn't add up.
5. Key Assumptions
This is the slide that separates thoughtful founders from template-fillers. List the 5 to 8 assumptions that drive your model, and show that they're grounded in data.
Good assumptions cite evidence: "Lead-to-close rate: 3.2% (based on 6 months of pipeline data)" or "Monthly churn: 4% (industry median for SMB SaaS per ChartMogul benchmarks)." Bad assumptions are round numbers without sources: "We assume 10% month-over-month growth."
If you don't have historical data yet, benchmark against comparable companies and say so explicitly. Investors respect founders who know what they don't know. They don't respect founders who present guesses as facts.
How to Build Revenue Projections: Step by Step
Start with Your Current State
Document where you are today. Pre-revenue? List your pipeline and conversion data. Post-revenue? Start from your actual MRR and layer on growth assumptions.
Model Three Scenarios
Build a base case (what you genuinely expect), an upside case (things go well, key hires land faster), and a downside case (slower growth, higher churn). Present the base case in your deck but have the other scenarios ready for diligence.
| Scenario | Year 1 ARR | Year 2 ARR | Year 3 ARR |
|---|---|---|---|
| Downside | $300K | $900K | $2.4M |
| Base Case | $500K | $1.8M | $5.5M |
| Upside | $720K | $3.0M | $9.0M |
Validate Against Benchmarks
Cross-check your projections against SaaS growth rate benchmarks. If your base case assumes faster growth than the top quartile of comparable companies, you need a compelling explanation for why you'll outperform.
One common trap: projecting 20% month-over-month growth for 36 straight months. That math produces $77M ARR from a $50K starting MRR, which is faster than almost any company in history. Growth rates naturally decelerate. Build that into your model or you'll lose credibility in the first 30 seconds of the meeting.
Calculate Your Revenue Projections
Pitch Deck Revenue Projector
Estimate your ARR trajectory for investor slides
Want to model this over 36 months with scenarios? Try Revenue Map free →
Common Mistakes That Kill Pitch Deck Financials
Showing only the hockey stick. A revenue chart that goes up and to the right tells investors nothing unless they can see the mechanics underneath. Pair every projection with the assumptions that produce it. What's the conversion rate? What's the churn rate? What happens if one of those assumptions is off by 30%?
Ignoring the cost side. Some founders show beautiful revenue projections and never address expenses. Investors will ask about gross margin, burn rate, and headcount plan. If you don't have answers ready, it signals that you haven't built a real financial model.
Internally inconsistent numbers. If your slide says CAC is $500 but your sales team costs $300K per year and you're projecting 200 new customers, the math produces a $1,500 CAC. Investors will catch this. Run your slides through a sanity check: do the inputs on one slide produce the outputs on the next?
Projecting flat churn. Churn rates change as you move upmarket, improve the product, and shift customer mix. A flat 5% monthly churn assumption for three years signals that you haven't thought about how retention evolves. Show how you expect churn to improve and why.
Too many decimal places. Projections three years out are directional, not precise. Writing "$4,837,291 ARR in Year 3" implies false precision. Round to meaningful numbers: "$4.8M ARR." Save the decimal places for your internal model.
What Investors Actually Look For
Here's the thing: investors aren't evaluating whether your Year 3 projection is exactly right. They know it won't be. They're evaluating three signals.
Internal consistency. Do your assumptions connect logically? If you project 500 enterprise customers but have no outbound sales team budgeted, the story falls apart.
Founder understanding. Can you explain every number on every slide without referring to notes? When an investor asks "what happens if churn doubles," can you answer with specifics?
Capital efficiency. How much revenue do you generate per dollar raised? The burn multiple (net burn divided by net new ARR) is the metric that captures this. A burn multiple below 2x is strong. Above 3x means you're spending too much relative to growth.
Key Takeaways
- Pitch deck financials need five slides: revenue projections, unit economics, burn and runway, use of funds, and key assumptions. Each slide should stand alone but connect logically to the others.
- Build revenue projections bottom-up from pipeline and conversion data, not top-down from market size. Show 12 to 18 months of monthly detail and 3-year annual summaries.
- Target an LTV:CAC ratio above 3x, CAC payback under 12 months, and post-raise runway of 18 to 24 months. These are the benchmarks investors use to filter deals quickly.
- Present a base case you genuinely believe, not a best-case-disguised-as-base-case. Investors discount projections by 30 to 50% regardless.
- Every assumption should cite a source: your own data, industry benchmarks, or comparable company analysis. Unsourced round numbers destroy credibility.
Ready to build investor-grade financial projections? Start with Revenue Map to create a complete financial model with projections, unit economics, and scenario analysis. Explore our SaaS financial model template to get your pitch deck numbers in minutes.
Related Articles
Laundromat Business Plan: Costs and Projections
Build the financial section of your laundromat business plan with startup costs, revenue benchmarks, and the projections lenders expect.
Car Wash Business Plan: Costs and Projections
Build the financial section of your car wash business plan with real startup costs, revenue projections, and the numbers lenders require.
Gym Business Plan: Costs, Revenue, Projections
Build the financial section of your gym business plan with real startup costs, membership revenue models, and cash flow projections lenders require.