Sales Forecast Template: How to Build One
A sales forecast template projects future revenue by multiplying the number of leads by your conversion rate and average deal size. Most startups should forecast monthly for 12 to 18 months, broken down by pipeline source and sales stage.
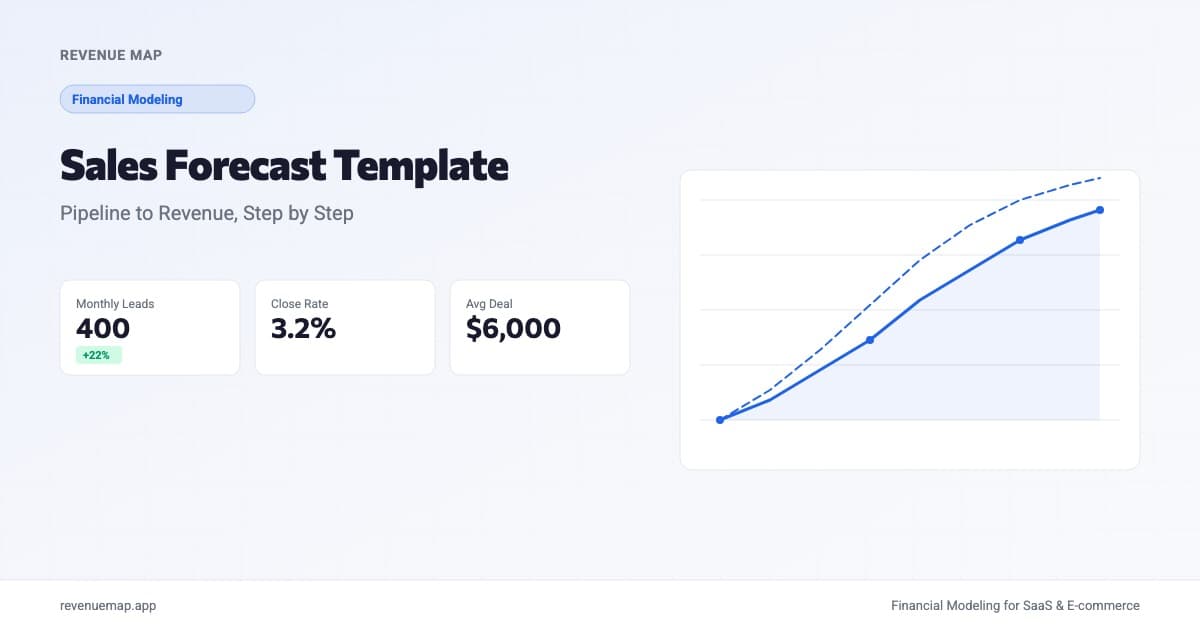
A sales forecast template is a model that projects how much revenue your startup will generate over a given period, based on your pipeline, conversion rates, and deal sizes. Instead of guessing at a monthly revenue number and hoping you hit it, a good forecast builds revenue from the bottom up: leads in, deals closed, cash collected. If you're raising capital or planning headcount, your sales forecast is the single most scrutinized piece of your financial projections.
Getting this right matters more now than it did a year ago. AI-powered sales tools are flooding startup pipelines with leads at unprecedented volume. SaaStr's recent analysis of AI SDRs makes a sharp point: these tools can 10x your outbound pipeline, but 10x times zero is still zero. If your targeting is wrong or your messaging doesn't resonate, more pipeline just means more noise. A structured sales forecast forces you to separate the signal (qualified pipeline that converts) from the volume (raw leads that never close), and that distinction is what makes the difference between a useful projection and a fiction.
What Is a Sales Forecast?
A sales forecast is a data-driven estimate of future revenue, built from measurable inputs rather than top-down assumptions. Where a revenue projection might start with "we think we can hit $100K MRR by December," a sales forecast starts with the mechanics: how many leads enter the pipeline each month, what percentage convert at each stage, what's the average deal value, and how long does the sales cycle take.
The core formula is straightforward:
Forecasted Revenue = Leads × Conversion Rate × Average Deal Size
In practice, you'll want to layer in additional dimensions: multiple lead sources (inbound, outbound, referrals), pipeline stages (qualified, demo, proposal, closed), and timing (sales cycle length delays when revenue actually arrives). But the formula above is the foundation.
Why Every Startup Needs a Sales Forecast Template
Without a forecast, you're flying blind on three critical decisions.
Hiring. When should you add a second sales rep? The answer depends on whether your current pipeline can support the CAC payback period for a new hire. A forecast that tracks pipeline by rep tells you exactly when capacity is maxed.
Cash planning. Revenue doesn't arrive the moment a deal closes. Payment terms, implementation timelines, and billing cycles create gaps between "closed-won" and "cash in bank." Your burn rate doesn't wait. A monthly forecast that accounts for collection lag keeps your runway projections honest.
Fundraising. Investors don't just ask what your revenue will be. They ask how you know. A bottom-up sales forecast that ties lead sources to conversion rates to revenue gives a credible answer. "We generate 400 inbound leads per month, convert 3.2%, and close at an average of $6,000 ACV" is a fundamentally different pitch than "we project $2M ARR by Q4."
How to Build a Sales Forecast: Step by Step
Step 1: Define Your Pipeline Stages
Start by mapping the stages a deal moves through from first touch to closed revenue. A common B2B SaaS pipeline looks like this:
| Stage | Definition | Typical Drop-off |
|---|---|---|
| Lead | Expressed interest (form fill, trial signup) | 60-70% drop |
| Qualified | Matches ICP, confirmed budget/need | 40-50% drop |
| Demo / Evaluation | Actively evaluating the product | 25-35% drop |
| Proposal | Received pricing, negotiating terms | 15-25% drop |
| Closed-Won | Signed contract, revenue recognized | Final |
Your stages will vary. The point is to define them before you start forecasting, so you can track conversion rates at each transition.
Step 2: Estimate Lead Volume by Source
Break your leads into channels. Each channel has different volume, cost, and conversion characteristics:
- Inbound organic (SEO, content, word of mouth): lower volume, higher conversion
- Inbound paid (Google Ads, social ads): scalable volume, moderate conversion
- Outbound (cold email, SDR prospecting, AI-generated pipeline): high volume, lower conversion
- Referrals and partnerships: low volume, highest conversion
If you're pre-revenue, estimate conservatively. Look at comparable companies in your space, or start with your current traffic and apply a 1 to 3% visitor-to-lead conversion rate.
Step 3: Apply Stage Conversion Rates
Multiply lead volume by the conversion rate at each stage. Here are benchmarks to use until you have your own data:
| Metric | Early-Stage Benchmark | Growth-Stage Benchmark |
|---|---|---|
| Lead to Qualified | 25-40% | 35-50% |
| Qualified to Demo | 40-60% | 50-70% |
| Demo to Proposal | 30-50% | 45-65% |
| Proposal to Close | 40-60% | 50-70% |
| Overall Lead to Close | 1-5% | 5-15% |
One caveat: these benchmarks assume reasonably targeted leads. AI SDR tools can generate massive outbound volume, but SaaStr's data shows that AI-sourced pipeline typically converts at 30 to 50% of the rate of human-sourced pipeline, at least until the targeting model is properly tuned. If you're using AI outbound, forecast those leads with a separate (lower) conversion rate rather than blending them into a single average.
Step 4: Set Your Average Deal Size
For SaaS, this is your average contract value per customer. For e-commerce, it's your average order value. If you have tiered pricing, weight by the expected plan mix:
Weighted ACV = (% on Starter × Starter Price) + (% on Growth × Growth Price) + (% on Enterprise × Enterprise Price)
Step 5: Account for Sales Cycle Length
A deal that enters the pipeline in January won't close in January. If your average sales cycle is 45 days, that January lead becomes March revenue. Shift your forecast forward by the average cycle length, or model each deal cohort with its own close date.
Step 6: Build the Monthly View
Combine everything into a 12-month grid. Each row is a month. Columns include: leads by source, stage conversions, deals closed, average deal size, and total new MRR. Sum the monthly new MRR cumulatively to see your revenue trajectory.
Calculate Your Sales Forecast
Sales Forecast Calculator
Estimate monthly revenue from your pipeline
Want to model this over 36 months with scenarios? Try Revenue Map free →
Sales Forecasting Methods Compared
Not every startup should forecast the same way. The right method depends on how much historical data you have.
| Method | Best For | How It Works | Limitation |
|---|---|---|---|
| Bottom-up (pipeline) | Startups with a sales process | Leads x conversion x deal size | Requires lead volume estimates |
| Top-down (market share) | Very early stage, pre-pipeline | TAM x realistic capture % | Often produces unrealistic numbers |
| Historical run-rate | Post-revenue with 6+ months data | Last quarter's revenue x growth rate | Ignores pipeline changes |
| Cohort-based | Subscription businesses | Model each monthly cohort's expansion and churn | Needs retention data |
| Rep capacity | Sales-led organizations | Reps x quota attainment x ramp time | Sensitive to hiring timing |
For most startups, the bottom-up pipeline method (Steps 1 through 5 above) is the best starting point. Once you have 6 or more months of real data, blend it with a historical run-rate to sanity-check your pipeline assumptions. If you're building a SaaS sales capacity model, the rep capacity method is the natural extension.
Common Sales Forecasting Mistakes
Forecasting from a single average conversion rate. Blending all lead sources into one conversion rate hides the real story. Your inbound leads might convert at 8% while outbound converts at 1.5%. A single 4% average makes outbound look profitable when it might not be, and makes inbound look less valuable than it is. Split by source.
Ignoring the ramp. New sales reps take 3 to 6 months to reach full productivity. If your forecast assumes a new hire starts closing at quota in month one, your projections will miss badly. Build in a ramp schedule: 25% of quota in month one, 50% in month two, 75% in month three, full productivity by month four.
Confusing pipeline value with forecasted revenue. A $500K pipeline with a 20% close rate is a $100K forecast, not a $500K forecast. Reporting pipeline as expected revenue is the most common way startups lose credibility with investors and board members.
Never updating the forecast. A sales forecast is a living model. Compare actual results to projections monthly, adjust conversion rates as you learn, and reforecast quarterly. The goal isn't to predict the future perfectly. It's to be less wrong each month.
Key Takeaways
- A sales forecast template builds revenue projections from the bottom up: leads, conversion rates, deal sizes, and sales cycle timing. This is more credible and actionable than top-down guesses.
- Break leads into sources (inbound, outbound, referrals) and forecast each with its own conversion rate. AI-sourced pipeline in particular tends to convert at lower rates than human-sourced leads.
- Use industry benchmarks (1 to 5% lead-to-close for B2B SaaS) as starting assumptions, then replace them with your own data as soon as you have 3 or more months of actuals.
- Account for sales cycle length by shifting closed deals forward. A 45-day cycle means January leads become March revenue.
- Update your forecast monthly against real results. The accuracy of the model matters more than the initial assumptions.
Need to connect your sales forecast to a full financial model? Build yours with Revenue Map and see how pipeline projections flow into revenue, burn rate, and runway in a single model. Explore our SaaS financial model to get started in minutes.
Related Articles
Financial Forecasting for Startups: A Practical Guide
Learn how to build and maintain startup financial forecasts. Covers five proven methods, re-forecasting cadence, accuracy benchmarks, and a free calculator.
Revenue Forecast Template for Startups (2026)
Build a revenue forecast from scratch. Grab our template with MRR growth formulas, churn adjustments, and expansion revenue built in.
Financial Projections Template: What to Include
Build a financial projections template with revenue forecasts, cost structure, cash flow, and scenario analysis. Includes formulas, benchmarks, and a free calculator.