Robotics Startup Financial Model: Costs, Margins, R&D
A robotics startup financial model projects revenue, BOM costs, R&D spending, and manufacturing margins for companies building physical products with embedded intelligence. Unlike SaaS models, it must account for hardware bill of materials, assembly labor, inventory, and production scaling.
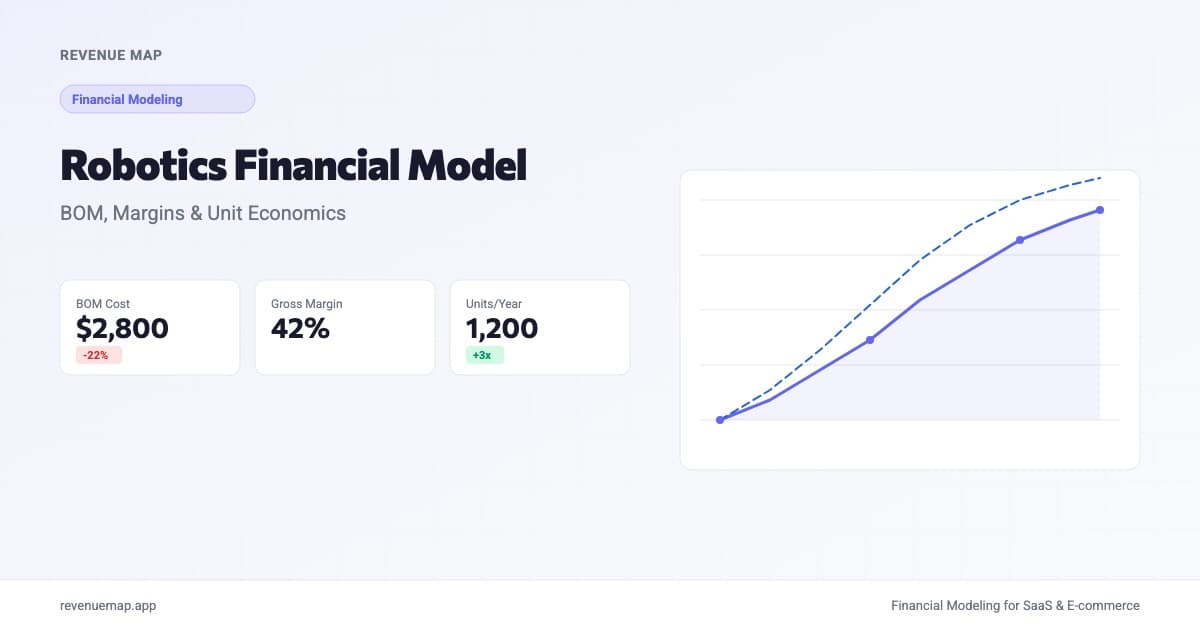
A robotics startup financial model is a structured projection of how a company building physical robots converts R&D investment into product revenue, accounting for bill of materials (BOM) costs, manufacturing scale-up, and the unique margin curve that separates hardware from software businesses. If you are building a financial model for a robotics company, the core challenge is quantifying costs that are tangible and lumpy: physical components, assembly labor, inventory, and the capital equipment needed to produce at scale.
Investor appetite for robotics is surging. Enigma, a robotics startup that makes controlling a robot as intuitive as adjusting a volume dial, just raised a $71M seed round led by Index Ventures and Ribbit Capital. That is one of the largest seed rounds in robotics history, and it signals that top-tier investors are betting on companies with clear paths to unit economics at production scale. But closing a round like that requires a financial model that speaks the language of hardware margins, not monthly recurring revenue.
What Makes Robotics Financial Models Different from SaaS?
Robotics financial models differ from SaaS financial models in four structural ways. Getting these right is what separates a credible pitch from one that investors dismiss in the first five minutes.
Physical bill of materials. Your COGS is not cloud hosting. It is sensors, actuators, microcontrollers, chassis materials, wiring harnesses, and packaging. Each component has a supplier, a lead time, and a price that changes with order volume. Your model needs a detailed BOM breakdown, not a single COGS line, because investors want to see which components drive cost and where volume discounts kick in.
Pre-revenue R&D burn. SaaS companies can ship a first version in weeks. Robotics startups typically spend 18 to 36 months in prototyping and testing before the first commercial unit ships. Your model must explicitly show this R&D phase with monthly burn rate, prototype iteration costs, and the milestones that trigger the transition from development to production.
Manufacturing scale economics. The cost of producing unit number 10 is radically different from the cost of producing unit number 10,000. Your model should show how BOM costs, assembly labor per unit, and overhead allocation change across at least three production volume tiers. This is the margin curve investors scrutinize most closely.
Working capital intensity. Robotics companies carry physical inventory: raw components, work-in-progress assemblies, and finished goods waiting for deployment. Enterprise customers often pay on 60 to 90 day terms. Your cash flow model must account for working capital cycles that eat into runway faster than most founders expect.
The Five Cost Categories in a Robotics Financial Model
1. Bill of Materials (BOM)
BOM is the total cost of every physical component in one unit. For a typical industrial or service robot, this includes sensors (LIDAR, cameras, IMUs), compute modules, actuators and motors, structural components, power systems, and connectivity hardware. BOM costs typically represent 30 to 50% of total unit cost at production scale, but can exceed 70% during early low-volume production when you are buying components at retail prices.
Model your BOM at three volume tiers. Component suppliers offer tiered pricing, and buying 100 motors costs far more per unit than buying 10,000. A realistic BOM model shows 15 to 30% cost reduction between prototype quantities and production-scale orders.
2. R&D and Engineering
R&D in robotics covers mechanical design, firmware development, sensor calibration, safety testing, and regulatory certification. Unlike software R&D that ships features continuously, robotics R&D produces discrete prototypes and hardware revisions. Budget for 3 to 5 prototype iterations before your design is production-ready, with each iteration costing $50K to $500K depending on complexity.
After product launch, R&D does not stop. Plan for ongoing engineering spend at 15 to 25% of revenue for hardware revisions, new sensor integration, and the software stack that makes the robot intelligent.
3. Assembly and Manufacturing Labor
Assembly cost per unit depends heavily on your production approach. Manual assembly by technicians works for the first 50 to 200 units but does not scale. Semi-automated production lines reduce per-unit labor costs by 40 to 60% once you pass 500 units annually. Fully automated lines require significant capex but bring labor per unit close to zero at high volumes.
Model this as a step function, not a smooth curve. Each manufacturing upgrade requires capital investment and a lead time of 3 to 9 months for installation and ramp-up.
4. Overhead and Facilities
Robotics companies need physical space: lab space for R&D, production floor for assembly, and warehouse space for inventory and shipping. Facility costs are relatively fixed, which means your overhead allocation per unit drops significantly as production volume increases. This is one of the strongest levers for margin improvement.
5. Field Operations and Support
Robots deployed in customer environments need installation, maintenance, and technical support. For enterprise robotics, plan for field service costs of 5 to 15% of hardware revenue. This is a cost category that SaaS founders often forget entirely when they pivot to hardware.
How to Calculate Robotics Unit Economics
The central question for any robotics investor is this: at what production volume do your unit economics work? Here is the formula at its simplest:
Unit Cost = BOM + Assembly Labor + (R&D Allocation / Units) + (Overhead / Units) + Field Service
And the resulting margin:
Gross Margin = (Selling Price - Unit Cost) / Selling Price × 100
Three of these five terms (R&D allocation, overhead, and to some extent BOM) decrease per unit as volume increases. That is why robotics margins follow a characteristic curve:
| Production Phase | Annual Units | Typical Gross Margin |
|---|---|---|
| Prototype/Pilot | 5 to 50 | Negative to 5% |
| Early Production | 50 to 500 | 10 to 25% |
| Growth | 500 to 5,000 | 25 to 40% |
| Scale | 5,000+ | 40 to 55% |
Companies that add a Robotics-as-a-Service (RaaS) layer, charging monthly subscriptions for software updates, analytics, and support, can push blended margins to 55 to 70% at scale because the recurring software revenue carries SaaS-like gross margins.
Calculate Your Robotics Unit Economics
Robotics Unit Cost Calculator
Estimate your per-unit cost and gross margin at a given production volume
Robotics vs. SaaS: Key Financial Model Differences
| Dimension | Robotics | SaaS |
|---|---|---|
| Time to first revenue | 18 to 36 months | 1 to 6 months |
| Primary COGS | BOM, assembly labor, components | Hosting, compute |
| Gross margin at scale | 40 to 55% (hardware), 55 to 70% (RaaS) | 70 to 85% |
| Capex requirements | High (tooling, production lines) | Low (cloud) |
| Revenue model | Unit sales, RaaS, service contracts | Subscription, usage-based |
| Inventory required | Yes (components, finished goods) | No |
| Working capital intensity | High (60 to 90 day payment terms) | Low |
| R&D to production cycle | 18 to 36 months | Continuous deployment |
The comparison matters because many robotics startups initially model their businesses as if they were software companies. If you present SaaS-like 75% gross margins to a hardware-savvy investor, you will lose credibility immediately.
The RaaS Revenue Model
One strategic choice that transforms the financial model is whether to sell robots outright or offer Robotics-as-a-Service. RaaS converts a large upfront sale ($10K to $100K per unit) into a monthly subscription ($1K to $5K per month). Here is the tradeoff.
Upfront sales generate immediate revenue and positive cash flow per unit. The model is simpler and CAC payback is immediate. But revenue is lumpy, and you lose the ongoing customer relationship.
RaaS creates predictable recurring revenue that investors value at higher multiples. It also enables remote monitoring, OTA updates, and data-driven upsells. The downside: you finance the hardware on your balance sheet, which requires more working capital and extends your startup burn rate before reaching breakeven. You can explore how different financial model templates handle this SaaS-like revenue structure.
Most successful robotics companies use a hybrid approach, selling hardware to large enterprise buyers while offering RaaS to mid-market customers who prefer opex over capex. Your financial model should show both scenarios.
Common Mistakes to Avoid
-
Using retail BOM prices in your scale projections. Your prototype BOM is not your production BOM. Component costs drop 15 to 30% at volume. Using prototype pricing in year-three projections makes your margins look worse than they will actually be, but using best-case pricing in year one does the opposite. Model the transition explicitly.
-
Ignoring certification and compliance costs. Robots operating in commercial environments need safety certifications (CE, UL, ISO standards) that cost $50K to $300K and take 3 to 12 months. These are not optional, and they delay your revenue start date. Build them into the timeline.
-
Treating software as free. The firmware, computer vision, and AI that make a robot intelligent require a dedicated software team. Many robotics models bury software costs in "R&D" and never separate them. Investors in companies like Enigma want to see the software investment because it creates defensibility and enables recurring revenue.
-
Skipping the working capital model. Buying $500K in components to build inventory while waiting 90 days for enterprise purchase orders to convert to cash can drain your runway faster than any operating expense. Model your cash conversion cycle explicitly.
Key Takeaways
- Robotics financial models must include a detailed BOM breakdown, not a single COGS line. Show how component costs decrease across three production volume tiers.
- Budget for 18 to 36 months and 3 to 5 prototype iterations before commercial production begins. Your R&D burn during this pre-revenue period is the most scrutinized part of the model.
- Gross margins follow a characteristic curve from negative (prototype) to 40 to 55% (production scale). RaaS models can reach 55 to 70% blended margins by layering recurring software revenue on top of hardware.
- The choice between upfront unit sales and RaaS subscriptions fundamentally changes your cash flow profile and working capital needs. Model both.
- Working capital, inventory, and certification costs are the line items that catch hardware-first founders off guard. Make them explicit.
Building a robotics financial model forces you to confront every cost that hides inside a physical product. Start building your model with Revenue Map to stress-test your unit economics across production volumes and find the scale point where your margins work.
Related Articles
Break-Even Analysis: How to Calculate for Startups
Learn how to calculate your break-even point with formulas, examples, and benchmarks. Includes a free calculator and tips for SaaS and e-commerce founders.
Construction Tech Financial Model for Startups
Build a construction tech financial model with project revenue, bid win rates, and contractor unit economics. Includes benchmarks and a revenue calculator.
Cybersecurity Financial Model: Revenue, Costs, Benchmarks
Build a cybersecurity startup financial model with benchmarks for ARR, margins, and unit economics. Covers seat-based and platform revenue.