Construction Tech Financial Model for Startups
A construction tech financial model forecasts revenue from contractor subscriptions and per-project transaction fees, along with contractor acquisition costs and operating margins. Most contech startups blend SaaS subscriptions with take rates of 1.5 to 4% on project value, targeting 70 to 80% gross margins on the software layer.
A construction tech financial model projects the revenue, costs, and profitability of a startup selling software or digital tools to the construction industry. The core question it answers: given your mix of subscription fees and per-project transaction revenue, how many contractor customers do you need to reach profitability? If you are building vertical SaaS for construction, this model is where your assumptions meet math.
Construction remains one of the least digitized major industries in the global economy. That gap is what makes the opportunity compelling, and what makes the financial model unusual. Cascade's recent $3.5 million seed round to help construction firms find and win projects shows investors are betting on the digitization wave accelerating. But modeling a contech startup requires understanding dynamics that standard SaaS templates miss entirely.
What Is a Construction Tech Financial Model?
A construction tech financial model is a forecasting tool that maps subscriber growth, project-based transaction volume, and operating costs for a startup selling to contractors, general contractors, subcontractors, or property developers. It differs from a generic SaaS financial model in three ways.
First, revenue is typically blended. Most construction tech startups charge a monthly subscription for platform access, plus a per-project fee or take rate when jobs flow through the system. This dual-revenue structure is common in vertical SaaS but especially pronounced in construction, where each project can be worth tens or hundreds of thousands of dollars.
Second, sales cycles are long and relationship-driven. A contractor evaluating project management software or a bidding platform does not sign up after watching a demo. They run a pilot on a single project, often lasting 60 to 90 days, before committing. Your model needs to account for this pipeline lag between lead and paying customer.
Third, the buyer base is fragmented and offline-first. Millions of construction firms operate in the U.S. alone, most of them small businesses with fewer than 20 employees. Marketing channels that work for typical B2B SaaS (content marketing, paid search) often underperform here. Industry trade shows, referral networks, and field sales matter more, and they cost more.
How to Model Blended Revenue
Start with your two revenue layers and project each one separately:
Monthly Subscription Revenue = Active Contractors x Monthly Subscription Price
Monthly Transaction Revenue = Projects Completed x Avg Project Value x Take Rate
Total Monthly Revenue = Subscription Revenue + Transaction Revenue
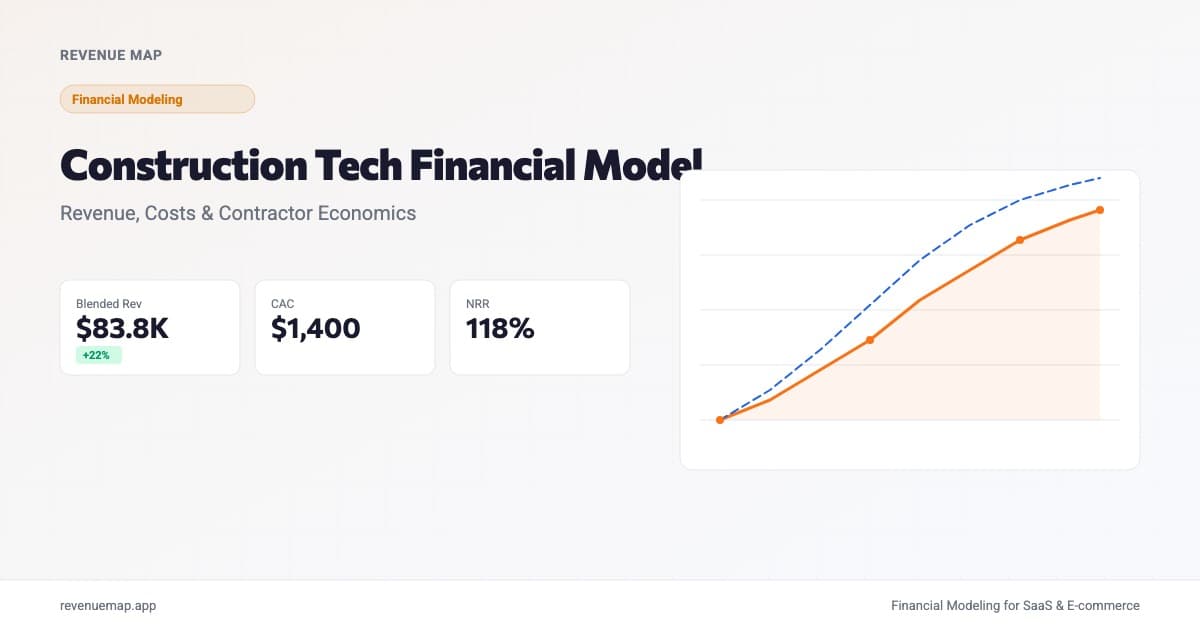
Worked example: You have 200 active contractor customers paying $149/month for your platform. Each month, 80 projects flow through your system at an average value of $45,000, and you charge a 1.5% take rate.
Subscription Revenue = 200 x $149 = $29,800
Transaction Revenue  = 80 x $45,000 x 0.015 = $54,000
Total Monthly Revenue = $29,800 + $54,000 = $83,800
In this example, transaction revenue accounts for 64% of total revenue. That ratio is important because transaction revenue scales with project volume, not just customer count. Many successful contech startups begin with a subscription-only model to build a user base, then layer in transaction fees once they have enough project flow to make the marketplace economics work.
One subtlety to model: seasonality. Construction activity in North America and Europe drops roughly 15 to 30% during winter months, depending on the region. Your revenue forecast should reflect this dip, or you will overstate first-year ARR by 10 to 20%.
Contractor Acquisition Costs
Customer acquisition in construction tech runs higher than typical B2B SaaS. The industry's offline habits mean that digital marketing alone rarely works. Here's the thing: a contractor who spends 10 hours a day on job sites is not scrolling LinkedIn or reading blog posts about project management software.
Expect blended CAC in the range of $800 to $2,500 per contractor, depending on deal size and segment. Enterprise general contractors (those doing $100M+ in annual revenue) can push CAC above $5,000 because of the pilot-then-commit sales motion.
CAC = Total Sales & Marketing Spend / New Customers Acquired
The good news: once a contractor adopts your platform and runs projects through it, switching costs are high. Project history, subcontractor relationships, and compliance documentation all live in your system. This translates to strong net revenue retention, often 110 to 125% for best-in-class construction tech companies, because customers expand by adding more users, more projects, and more modules over time.
Keep your CAC payback period under 18 months. For a $149/month subscription with 80% gross margin, that means keeping CAC below about $2,145.
CAC Payback (months) = CAC / (ARPA x Gross Margin %)
Calculate Your Blended Revenue
Construction Tech Revenue Calculator
Estimate monthly revenue from subscriptions and project transactions
Want to model this over 36 months with scenarios? Try Revenue Map free →
Construction Tech Benchmarks
| Metric | Seed Stage | Series A | Best in Class |
|---|---|---|---|
| ARR | $300K-$1M | $2M-$5M | $10M+ |
| Gross Margin (SaaS layer) | 65-75% | 70-80% | 78%+ |
| Monthly Logo Churn | 3-5% | 2-3% | Under 1.5% |
| NRR | 100-110% | 110-120% | 125%+ |
| CAC Payback | 14-20 months | 10-14 months | Under 10 months |
| Blended Take Rate | 1-2% | 1.5-3% | 2-4% |
These benchmarks reflect comparable vertical SaaS companies selling to fragmented, offline-first industries. Startups with managed services or labor marketplace components will run lower gross margins (40 to 60%) but may grow revenue faster because of higher average contract values.
One caveat: construction tech is still a young category. Benchmarks vary widely, and investors tend to be more forgiving of longer payback periods if you can demonstrate strong NRR and project volume growth. The strategic question is whether you are building a tool (SaaS margins, slower growth) or a platform (lower margins, faster compounding via network effects).
Common Modeling Mistakes
-
Treating all contractors as equal. A three-person roofing crew and a 500-person general contractor have completely different willingness to pay, onboarding timelines, and expansion potential. Segment your model into at least two tiers (SMB and enterprise) with separate ARPA, churn, and CAC assumptions for each.
-
Ignoring pilot conversion rates. If your sales motion involves a free or discounted pilot, model the conversion from pilot to paying customer explicitly. A 60% pilot-to-paid conversion rate with a 90-day pilot means your effective sales cycle is not 30 days. It is closer to five months when you include the pilot period and negotiation.
-
Flat-lining project volume. Transaction revenue depends on how many projects your customers run through the platform. That number grows with both customer count and per-customer adoption depth. Model adoption curves: in Month 1 a contractor might put one project on the platform, but by Month 6 they may route all their projects through it.
-
Underestimating compliance costs. Construction involves permits, insurance certificates, safety documentation, and prevailing wage calculations. If your platform touches any of these, you will need compliance-related engineering and legal expenses that a horizontal SaaS model would not include. Budget 5 to 10% of operating expenses for compliance infrastructure during the first two years.
-
Projecting national growth without a regional go-to-market plan. Construction is deeply local. A platform that works well in Texas may need significant adjustments for New York's regulatory environment. Model your growth city by city or region by region rather than assuming uniform national adoption. This discipline also makes your burn rate more predictable.
Key Takeaways
- Construction tech financial models should separate subscription revenue from transaction revenue, because each scales on different drivers (customer count versus project volume).
- Blended CAC typically runs $800 to $2,500 per contractor, higher than standard B2B SaaS, but strong retention (NRR of 110 to 125%) justifies the upfront spend.
- Seasonality reduces construction activity 15 to 30% in winter months. Your revenue forecast needs to account for this or it will overstate first-year ARR.
- Segment contractors by size. A three-person crew and a 500-person GC have fundamentally different economics, sales cycles, and expansion trajectories.
- Best-in-class construction tech companies achieve 70 to 80% gross margins on their SaaS layer, with transaction fees adding incremental revenue at 1.5 to 4% take rates.
Building a contech financial model from scratch? Start with Revenue Map and explore B2B SaaS startup ideas across verticals to model your unit economics in minutes.
Related Articles
Break-Even Analysis: How to Calculate for Startups
Learn how to calculate your break-even point with formulas, examples, and benchmarks. Includes a free calculator and tips for SaaS and e-commerce founders.
Robotics Startup Financial Model: Costs, Margins, R&D
Build a financial model for a robotics startup. Covers BOM costs, R&D burn, manufacturing margins, and the unit economics investors need to see.
Cybersecurity Financial Model: Revenue, Costs, Benchmarks
Build a cybersecurity startup financial model with benchmarks for ARR, margins, and unit economics. Covers seat-based and platform revenue.