Cybersecurity Financial Model: Revenue, Costs, Benchmarks
A cybersecurity financial model projects revenue from seat-based or platform licensing, accounts for high gross margins typically between 70% and 85%, and factors in the long enterprise sales cycles common in security software.
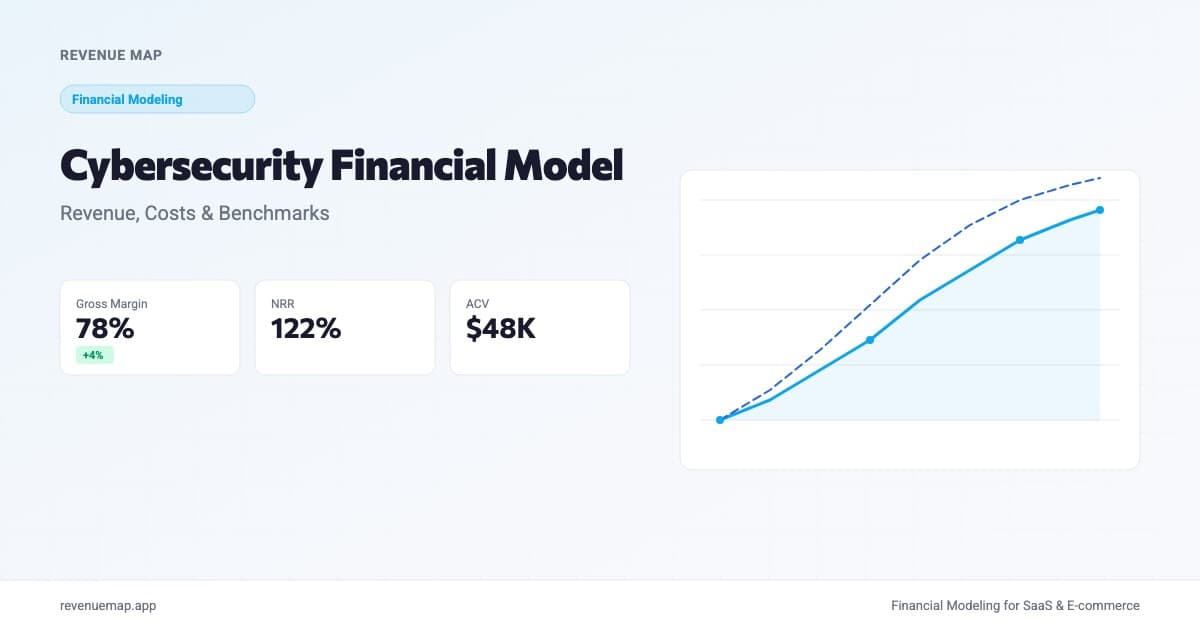
A cybersecurity financial model maps how a security software company generates revenue, manages costs, and reaches profitability. Unlike a general SaaS financial model, it needs to account for longer enterprise sales cycles, compliance-driven purchasing, and the multi-product expansion path that defines how cybersecurity companies scale.
The timing for building one is compelling. As AI companies scale to record valuations, the attack surface they create expands in parallel. Databricks recently hit $188B on the back of open-weight AI model adoption, and every new AI deployment needs data protection, endpoint security, and access controls. That makes cybersecurity one of the most durable verticals in enterprise software for founders building financial projections today.
What Makes Cybersecurity Unit Economics Different?
Cybersecurity has a few structural advantages that set its financial profile apart from standard SaaS.
First, retention is exceptionally strong. Once a security product is embedded in an organization's infrastructure, removing it creates real operational risk. No CISO wants to swap firewall vendors and risk a breach during the transition window. This stickiness drives net revenue retention rates that routinely exceed 120% at the best companies, among the highest of any SaaS vertical.
Second, expansion revenue is built into the model. Security needs grow with headcount, data volume, and infrastructure footprint. A company that starts with endpoint protection for 500 employees will need coverage for 800 employees two years later, plus cloud workload security and identity management on top of that. Each product line becomes a natural upsell motion.
Third, gross margins run high. Cloud-native cybersecurity products typically achieve 75% to 85% gross margins because delivery is pure software. There is no physical hardware, no on-premise installation team, and minimal per-customer customization. Managed detection and response (MDR) services are the exception, running closer to 50% due to analyst labor costs.
Here's the tradeoff: customer acquisition is expensive. Enterprise security buyers are skeptical by nature, procurement cycles are long, and proof-of-concept requirements add months to every deal. CAC payback periods in cybersecurity often stretch to 18 to 24 months, well above the SaaS median. Your model needs to account for this cash drag, especially in early stages when your customer base is small and each delayed deal hits hard.
Key Revenue Streams to Model
Most cybersecurity startups generate revenue through one or more of these streams:
Seat-based licensing is the most common model, especially for endpoint, identity, and email security products. Price per user per month (or per year) multiplied by protected users gives you recurring revenue. This model is predictable and easy for investors to benchmark.
Platform fees work well for cloud security, SIEM, and data protection products. Customers pay a base platform fee plus consumption charges based on data ingested, events processed, or assets scanned. This structure captures value from both small and large deployments.
Usage-based pricing is gaining traction for API security and application security testing, where workload volume varies by customer. Revenue scales with usage, which creates higher net revenue retention but introduces forecast variance you need to model explicitly.
Professional services typically accounts for 5% to 15% of total revenue in the early stages (implementation, configuration, compliance mapping) and should shrink as a percentage over time. Model it separately because it carries lower margins, usually 30% to 50%.
How to Forecast Cybersecurity ARR
The core revenue formula for a seat-based cybersecurity product:
ARR = Customers x Average Contract Value (ACV)
For a blended model with both seat and platform revenue:
Blended ARR = (Seat Customers x Seat ACV) + (Platform Customers x Platform ACV)
Start your forecast from the bottleneck, which in cybersecurity is almost always sales capacity. Enterprise deals require dedicated account executives, and each AE can typically manage 15 to 25 active opportunities at a time. Work backwards from headcount:
New ARR = Active AEs x Quota Attainment Rate x Average ACV
Say you have 4 AEs each carrying $800K annual quota at 70% attainment. That produces roughly $2.24M in new ARR for the year. Layer in expansion revenue from existing customers (model this as a percentage of beginning-of-period ARR, typically 10% to 20% for cybersecurity) and subtract churned revenue to get your ending ARR.
Calculate Your Cybersecurity ARR
Cybersecurity ARR Calculator
Estimate annual recurring revenue from customer count and average contract value
Want to model this over 36 months with scenarios? Try Revenue Map free →
Cybersecurity vs. General SaaS Benchmarks
| Metric | Cybersecurity (Median) | General SaaS (Median) | Top Quartile Cyber |
|---|---|---|---|
| Gross Margin | 75-80% | 70-75% | 82-85% |
| Net Revenue Retention | 115-125% | 105-115% | 130%+ |
| Logo Churn (Annual) | 5-8% | 8-12% | Under 5% |
| CAC Payback | 18-24 months | 12-18 months | 12-15 months |
| Sales Cycle (Enterprise) | 3-9 months | 2-6 months | 2-4 months |
| R&D as % of Revenue | 25-35% | 20-30% | 20-25% |
| S&M as % of Revenue | 40-55% | 35-50% | 30-40% |
The biggest outlier is sales and marketing spend. Cybersecurity companies consistently spend more on go-to-market than their SaaS peers because enterprise buyers require hands-on selling: security assessments, POC deployments, and compliance documentation before signing. Model this line item carefully because it is the primary reason cybersecurity startups burn more cash than comparably sized SaaS companies despite having higher gross margins.
Cost Structure: What to Include
A realistic cybersecurity financial model needs these cost categories:
Cost of Goods Sold (COGS): Cloud infrastructure (hosting, data processing), third-party threat intelligence feeds, and customer support headcount directly tied to delivery. Target 15% to 25% of revenue.
Research and Development: Engineering salaries, security researchers, and threat lab operations. Cybersecurity R&D runs higher than typical SaaS because the product must constantly evolve against new attack vectors. Budget 25% to 35% of revenue in the early stages.
Sales and Marketing: The largest line item for most cybersecurity startups. Include AE and SDR compensation (with commissions), channel partner fees, event sponsorships (RSA, Black Hat), and content marketing. Early-stage companies often spend 50% or more of revenue here.
General and Administrative: Legal, compliance certifications (SOC 2, ISO 27001, FedRAMP), finance, and HR. Cybersecurity companies bear higher compliance costs than most SaaS verticals because customers expect their security vendors to meet the same standards being sold.
Track your overall burn rate monthly and model your runway under both base-case and pessimistic assumptions. With high S&M spend and long sales cycles, cybersecurity startups can burn through cash quickly even when per-customer unit economics look strong on paper.
Common Mistakes in Cybersecurity Financial Models
-
Underestimating the sales cycle. Founders from non-security backgrounds often model 30-day close rates. Enterprise cybersecurity deals take 3 to 9 months. Build this lag into your cash flow projections: bookings in Q1 may not convert to recognized revenue until Q3.
-
Ignoring channel economics. Many cybersecurity products sell through MSSPs, VARs, or technology alliances. Channel deals carry 20% to 40% partner margins that reduce your net revenue per deal. Model direct and channel revenue separately.
-
Treating all seats equally. Pricing by user count works until a prospect says "we have 50,000 endpoints." Enterprise volume discounts compress ACV per seat significantly. Tier your pricing model and reflect those tiers in your forecast rather than using one flat ARPU.
-
Forgetting compliance costs. FedRAMP authorization alone can cost $500K to $1M and take 12 to 18 months. If your go-to-market includes government or regulated industries, model these certification costs explicitly. They are lumpy capital investments, not typical operating expenses.
Key Takeaways
- Cybersecurity companies enjoy structural advantages in retention and margins, with NRR commonly above 120% and gross margins between 75% and 85%.
- The tradeoff is expensive customer acquisition: sales cycles run 3 to 9 months and CAC payback periods stretch to 18 to 24 months.
- Model revenue from the sales capacity bottleneck (AEs times quota times attainment), not from a top-down TAM percentage.
- Separate direct and channel revenue in your model because partner margins significantly reduce net revenue per deal.
- R&D and compliance costs run higher than typical SaaS. Budget for ongoing threat research and certifications like SOC 2 and FedRAMP.
If you are building a cybersecurity startup and need to pressure-test your economics, start with a SaaS financial model template in Revenue Map and adjust for the retention, sales cycle, and cost dynamics covered here. It takes less than five minutes to get your first projection.
Related Articles
SaaS Revenue Model Template for Startups
Build a SaaS revenue model from scratch with MRR components, pricing tier math, and expansion revenue. Includes a free calculator and benchmarks.
B2B SaaS Financial Model: Templates and Benchmarks
Build a B2B SaaS financial model with enterprise sales cycles, annual contracts, and expansion revenue. Includes 2026 benchmarks and a free ARR calculator.
Revenue Forecast Template for Startups (2026)
Build a revenue forecast from scratch. Grab our template with MRR growth formulas, churn adjustments, and expansion revenue built in.