SaaS Rule of 40: How to Calculate and Benchmark It
The Rule of 40 is a SaaS benchmark where your revenue growth rate plus profit margin should equal or exceed 40%. A company growing 30% with a 15% margin scores 45 and passes the test.
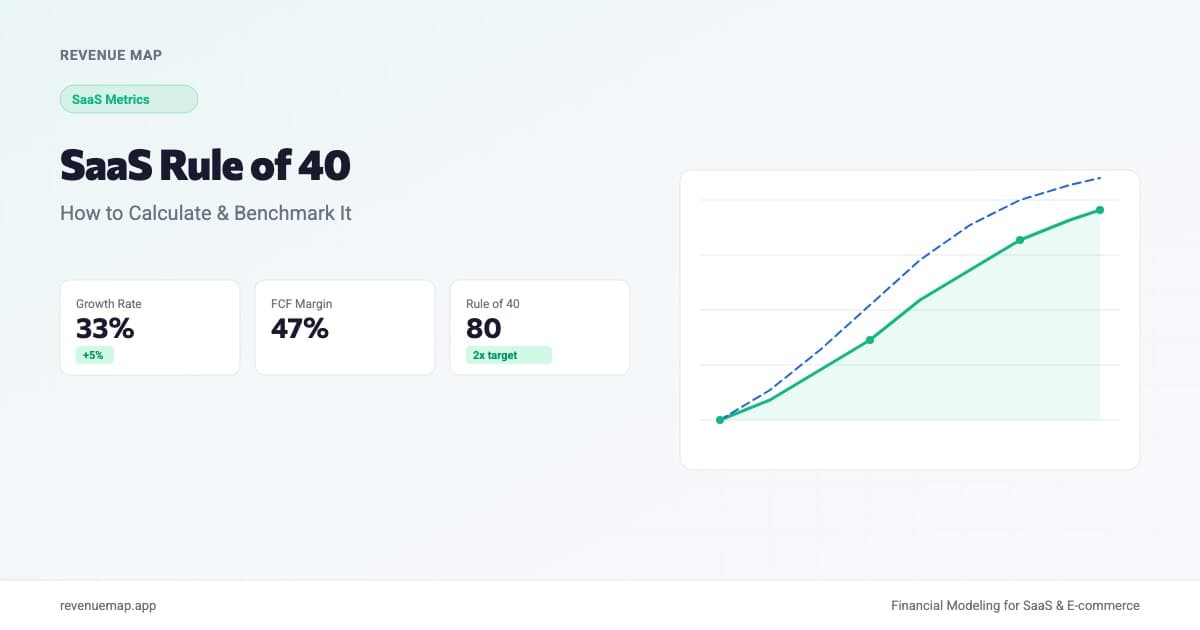
The Rule of 40 is a SaaS benchmark that combines your revenue growth rate and profit margin into a single number. If that number hits 40 or higher, your business is balancing growth and profitability at a healthy level. The formula is simple: add your year-over-year revenue growth rate (as a percentage) to your profit margin (as a percentage). A company growing 25% with a 15% margin scores 40 and passes.
This benchmark is back in the spotlight because of Stripe's latest financial data, reported by The Information and analyzed by SaaStr. Stripe posted $6.8 billion in 2025 revenue with 33% year-over-year growth and 47% free cash flow margins. That puts their Rule of 40 score at roughly 80, double the passing threshold, at a scale where most companies struggle to maintain either metric individually. For founders building their SaaS financial models, Stripe's numbers offer a useful ceiling benchmark and a reminder that the Rule of 40 isn't just academic.
What Is the Rule of 40?
The Rule of 40 is a framework, originally popularized by venture investor Brad Feld, that gives SaaS companies a single scorecard for evaluating the tradeoff between growth and profitability. The core idea: fast growth excuses low margins, and high margins excuse slow growth, but you need enough of at least one to be building a durable business.
Rule of 40 Score = Revenue Growth Rate (%) + Profit Margin (%)
A company growing 60% YoY with a negative 15% margin scores 45 and passes. A company growing 10% with a 35% margin also scores 45 and passes. A company growing 15% with a 5% margin scores 20 and fails, which signals that it is neither capturing market share quickly nor generating sustainable returns.
The elegance of the framework is that it makes different business profiles comparable. A high-growth seed-stage startup and a mature, profitable SaaS company can both pass or fail the same test. That said, investors weight the components differently depending on stage (more on that below).
How to Calculate Your Rule of 40 Score
Step 1: Measure Your Revenue Growth Rate
Use year-over-year ARR growth. If you don't have a full year of data, annualize your monthly growth rate: take your month-over-month growth percentage, compound it over 12 months, and subtract 1.
Annualized Growth = (1 + Monthly Growth Rate)^12 - 1
For example, 5% MoM growth annualizes to roughly 80% YoY.
Step 2: Choose Your Profit Margin
The Rule of 40 doesn't prescribe which margin to use, and this is where it gets nuanced. The three most common options are:
| Margin Type | What It Captures | Best For |
|---|---|---|
| EBITDA Margin | Operating profitability before interest, taxes, depreciation | Most common default, easy to compare |
| Free Cash Flow Margin | Actual cash generated after all operating expenses and capex | Best when stock-based compensation is significant |
| Operating Margin | GAAP operating income divided by revenue | Most conservative, includes SBC |
Stripe's 47% margin is measured on a free cash flow basis. If your company has minimal stock-based compensation and capex, EBITDA and FCF margins will be similar. If you have heavy SBC (common at later stages), FCF margin is the more honest measure because EBITDA hides that dilution cost.
For early-stage startups, keep it simple: use EBITDA margin or operating margin from your P&L. What matters is consistency. Pick one and track it over time.
Step 3: Add Them Together
Rule of 40 Score = YoY Revenue Growth (%) + Profit Margin (%)
If the result is 40 or above, you pass.
Calculate Your Rule of 40 Score
Rule of 40 Calculator
Add your growth rate and profit margin to see your score
2026 Rule of 40 Benchmarks by Stage
The benchmark shifts depending on where you are. Early-stage companies should lean toward growth; later-stage companies need to show a path to margins.
| Stage | Typical Score Range | Investor Expectation | Example Profile |
|---|---|---|---|
| Seed / Pre-Series A | 50-100+ | Growth dominant, margins negative | 80% growth, -20% margin = 60 |
| Series A | 40-70 | High growth, improving unit economics | 50% growth, -5% margin = 45 |
| Series B | 35-55 | Balance shifting toward efficiency | 35% growth, 10% margin = 45 |
| Growth / Series C+ | 30-50 | Margins expected to be positive | 25% growth, 20% margin = 45 |
| Public SaaS (median) | 20-40 | Profitability carries more weight | 15% growth, 20% margin = 35 |
Here's the thing: the median public SaaS company does not pass the Rule of 40. Only the top quartile consistently scores above 40. This is partly why companies that do pass, especially at scale, command premium valuation multiples. Stripe's score of 80 at $6.8 billion in revenue is extraordinary precisely because maintaining both high growth and high margins gets exponentially harder as you scale.
For early-stage founders, a common trap is treating a high score as an unqualified win. A seed company growing 120% with a negative 60% margin scores 60, which looks great on paper. But investors at that stage care more about the growth component than the composite score. If your growth rate is below 50% at seed, a high Rule of 40 score driven entirely by margins usually means you're not investing aggressively enough in acquisition.
How to Improve Your Rule of 40 Score
There are two levers, and the right one depends on your stage.
If you're early-stage (prioritize growth):
- Increase your net revenue retention above 110% so existing customers compound your growth without additional CAC spend
- Shorten your CAC payback period to reinvest acquired dollars faster
- Focus marketing spend on channels with proven unit economics rather than spreading thin across experiments
If you're later-stage (prioritize margins):
- Improve gross margins by renegotiating infrastructure contracts, reducing support costs through self-serve tooling, or optimizing compute for AI-heavy features
- Reduce burn rate by cutting underperforming initiatives rather than making across-the-board reductions
- Shift toward expansion revenue from existing accounts, which carries near-zero incremental acquisition cost
The honest answer is that most improvements come from operational discipline, not strategic pivots. Companies that track their Rule of 40 score monthly catch margin erosion or growth deceleration early enough to correct course before the next board meeting.
Common Mistakes When Using the Rule of 40
-
Mixing margin definitions across comparisons. If you benchmark your EBITDA-based score against a company reporting FCF margins, the comparison is misleading. Stock-based compensation alone can create a 10-15 point gap between the two measures. Always confirm you're comparing the same margin type.
-
Using trailing growth when forward growth is decelerating. Your Rule of 40 score based on last year's growth rate flatters you if growth is slowing. Investors will run the math on your projected growth rate for the next 12 months. If you grew 50% last year but are tracking toward 30% this year, your real Rule of 40 position is lower than the trailing number suggests.
-
Treating 40 as a binary pass/fail. The Rule of 40 is a heuristic, not a law. A company at 38 isn't meaningfully different from one at 42. What matters is the trend: are you improving or deteriorating? And is the mix of growth and margin appropriate for your stage? A Series A company scoring 40 through 5% growth and 35% margins is in worse shape than one scoring 35 through 40% growth and negative 5% margins.
Key Takeaways
- The Rule of 40 adds your growth rate to your profit margin, creating a single score that balances speed and sustainability. Forty or above is the benchmark.
- Stripe's score of 80 (33% growth + 47% FCF margin at $6.8B revenue) shows what elite performance looks like, but the median public SaaS company falls below 40.
- Stage matters. Early-stage companies should lean toward growth; later-stage companies need margins. A high score driven by the wrong component for your stage can mislead.
- Track it monthly and watch the trend, not just the snapshot. A declining score signals trouble before it shows up in your fundraising conversations.
- Use the right margin metric. FCF margin is the most honest measure, especially at later stages when stock-based compensation is significant.
Your Rule of 40 score belongs in every board deck and investor update. Build your SaaS financial model in Revenue Map to track growth, margins, and efficiency metrics in one place, and see how scenario changes affect your score in real time.
Related Articles
SaaS Revenue Per Employee: 2026 Benchmarks
How much ARR should each employee generate? See 2026 SaaS revenue per employee benchmarks by stage and growth rate, with formulas and a free calculator.

SaaS Gross Margin: How to Calculate and Benchmark It
Learn how to calculate SaaS gross margin, what counts as COGS, and 2026 benchmarks by company stage. Includes a free calculator.

SaaS Growth Rate Benchmarks: What to Target in 2026
What SaaS growth rate should you target? See 2026 benchmarks by stage, from seed to public, plus formulas and efficiency metrics.