SaaS Revenue Per Employee: 2026 Benchmarks
SaaS revenue per employee measures how much annual recurring revenue each team member generates. Good benchmarks range from $150K to $300K ARR per employee depending on company stage, with top-performing public SaaS companies exceeding $500K.
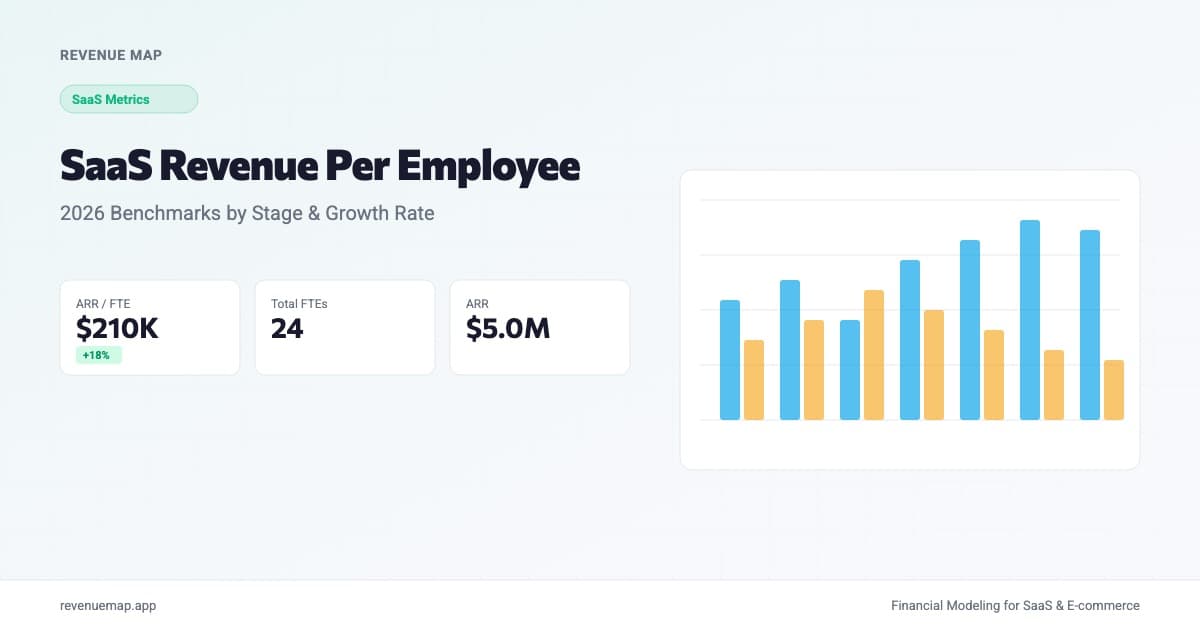
SaaS revenue per employee measures how much annual recurring revenue each team member generates. It is the single clearest signal of whether your company is scaling efficiently or just scaling expensively. For most SaaS businesses, the benchmark falls between $150K and $300K ARR per employee, with early-stage companies running lower and mature public companies pushing past $500K.
This metric is getting sharper attention right now because of a striking divergence in how SaaS companies are handling headcount. According to ICONIQ's latest data covered by SaaStr, SaaS companies growing at 100%+ added 133% more headcount in H1 2026. Meanwhile, companies growing 50-100% cut hiring nearly in half. That split means the revenue-per-employee gap between growth bands is widening faster than at any point since the 2021 boom.
What Is Revenue Per Employee?
Revenue per employee is a productivity ratio that divides a company's total revenue (or ARR for SaaS) by its full-time equivalent headcount. It answers a simple question: how much output does each person in the organization produce?
Revenue Per Employee = Annual Recurring Revenue / Total FTEs
For a SaaS company with $12M ARR and 60 employees, revenue per employee is $200K. That number tells you more about operational health than most metrics on your dashboard. It captures the combined effect of pricing power, go-to-market efficiency, product leverage, and organizational bloat (or the lack of it).
The metric is sometimes called ARR per employee or ARR per FTE. For pure SaaS companies these mean the same thing. If your revenue includes a meaningful services component, strip that out and calculate ARR per employee separately to get a clean read on software-specific efficiency.
Why Revenue Per Employee Matters for Startups
Here's the thing: every hire is an implicit bet that the marginal revenue they generate will exceed their fully loaded cost. Revenue per employee is how you check whether that bet is paying off.
- It constrains your burn rate. Payroll typically accounts for 60-80% of SaaS operating expenses. If your revenue per employee is $120K but your average fully loaded cost per employee is $150K, every hire widens the gap between revenue and expenses. That math eventually shows up in your runway calculation.
- It signals scalability to investors. A company that can grow ARR from $5M to $15M while only going from 30 to 50 employees (revenue per employee jumping from $167K to $300K) tells a different story than one that goes from 30 to 120 employees to hit the same target. Investors use this metric during diligence to separate businesses that scale from businesses that just grow.
- It reveals hidden inefficiency. A declining revenue-per-employee trend often precedes a profitability crisis. If you are hiring faster than revenue is growing, the metric drops, and the compounding effect of additional salaries, benefits, and overhead accelerates your cash consumption.
2026 Revenue Per Employee Benchmarks
The benchmarks below reflect public SaaS data, investor reports, and the patterns we see across financial models built on our platform. Use them as directional targets, not rigid rules. Industry, pricing model, and geography all create meaningful variation.
| Company Stage | Typical ARR Range | Revenue Per Employee | Top Quartile |
|---|---|---|---|
| Seed | Under $1M | $80K-$120K | $150K+ |
| Series A | $1M-$5M | $120K-$180K | $200K+ |
| Series B | $5M-$20M | $180K-$250K | $300K+ |
| Series C+ | $20M-$100M | $220K-$300K | $350K+ |
| Public SaaS | $100M+ | $250K-$400K | $500K+ |
A few caveats worth noting. Seed-stage companies naturally run lower because they are building the team before the revenue engine kicks in. You need engineers, a designer, and maybe a first salesperson before you have meaningful ARR. That is expected, and nobody penalizes a seed company for $90K revenue per employee.
The jump between Series A and Series B is where the metric becomes diagnostic. If you raised an A, hired aggressively, and your revenue per employee dropped rather than held steady or climbed, that signals a go-to-market problem. Either your new hires are not productive yet (ramp time) or your sales motion does not scale with headcount (a structural issue).
The ICONIQ data adds a growth-rate dimension to these benchmarks that is worth highlighting. Companies growing at 100%+ are adding headcount at 133%, which means their revenue per employee is actually declining in the short term. They are making a deliberate bet that today's hiring will fuel tomorrow's revenue. Companies in the 50-100% growth band are doing the opposite: cutting headcount to push revenue per employee higher and preserve margins.
Neither approach is universally right. The 100%+ growers can afford temporary efficiency loss because their growth rate compounds away the dilution within a few quarters. The 50-100% growers cannot. For them, hiring ahead of revenue creates a cost structure that their growth rate will not bail out.
How to Calculate Revenue Per Employee
Step 1: Pin Down Your ARR
Use your current annualized recurring revenue. Exclude one-time fees, professional services revenue, and hardware sales. If you charge annually, your ARR is straightforward. If you have a mix of monthly and annual contracts, annualize the monthly contracts: multiply MRR by 12 and add annual contract value.
ARR = (Monthly Subscribers × Monthly Price × 12) + Annual Contract Revenue
Step 2: Count Your Full-Time Equivalents
Include every full-time employee across all departments. Convert part-time workers and long-term contractors to FTE equivalents (a contractor working 20 hours per week is 0.5 FTE). Do not include short-term freelancers or agencies, as those costs flow through operating expenses differently.
The honest answer is that most startups undercount their FTEs. That offshore QA team of six contractors? Those are FTEs for this calculation. The part-time CFO working three days a week? That is 0.6 FTE. Precision here keeps the metric honest.
Step 3: Divide
Revenue Per Employee = ARR / Total FTEs
Worked example: a Series A SaaS company has $3.2M ARR and 22 full-time employees plus 4 contractors at 0.5 FTE each. Total FTEs = 22 + (4 × 0.5) = 24. Revenue per employee = $3,200,000 / 24 = $133,333. That falls squarely in the typical range for Series A, suggesting the company is staffed appropriately for its revenue level.
Calculate Your Revenue Per Employee
Revenue Per Employee Calculator
Calculate your ARR per full-time equivalent employee
Want to model this over 36 months with scenarios? Try Revenue Map free →
How to Improve Revenue Per Employee
Improving this metric comes down to one of two levers: grow revenue faster than headcount, or hold headcount while growing revenue.
Raise prices or expand ARPU
The fastest path to higher revenue per employee is charging more per customer. A 15% ARPU increase flows directly to the numerator without touching the denominator. Expansion revenue through upsells and cross-sells does the same thing. Companies with strong net revenue retention above 120% naturally improve revenue per employee over time because existing customers generate more revenue without requiring proportionally more staff.
Invest in product-led growth
Self-serve onboarding, in-app tutorials, and automated billing reduce the number of people needed per dollar of revenue. A product-led SaaS company might need one customer success manager per 200 accounts. A high-touch enterprise model might need one per 15. The revenue-per-employee implications are dramatic.
Be intentional about hiring timing
The ICONIQ data underscores this point. Hiring ahead of revenue only works if your growth rate is high enough to absorb the temporary efficiency loss. Before making your next hire, calculate what your revenue per employee will be in six months with and without that person. If the post-hire projection drops below your stage benchmark and your growth rate is under 80% YoY, consider whether automation or process improvements could close the gap instead.
Revenue Per Employee vs. Other Efficiency Metrics
Revenue per employee does not work in isolation. Pair it with these metrics for a complete efficiency picture:
| Metric | What It Tells You | Relationship |
|---|---|---|
| Rule of 40 | Growth + margin balance | A healthy Rule of 40 score with low revenue per employee suggests margin problems |
| SaaS Gross Margin | Delivery cost efficiency | Low gross margin mechanically limits revenue per employee contribution to profit |
| Burn Rate | Cash consumption speed | Revenue per employee declining while burn rises is a red flag |
| CAC Payback Period | Sales efficiency | High CAC payback with low revenue per employee means you are overspending on sales staff |
| LTV/CAC Ratio | Unit economics health | Strong LTV/CAC with improving revenue per employee indicates sustainable scaling |
That said, revenue per employee does not account for the quality or timing of hires. A company that just hired 15 engineers for a new product line will show a temporary dip. That is expected. The metric is most useful when tracked as a trend over 4-6 quarters rather than evaluated at a single point.
Common Mistakes to Avoid
- Ignoring contractor headcount. Excluding contractors flatters the metric and misleads investors during diligence. Include all labor that contributes to the product, regardless of employment type.
- Comparing across industries. A vertical SaaS company selling to hospitals will have different revenue-per-employee benchmarks than a horizontal SMB tool. Compare within your segment, not across all SaaS.
- Optimizing the metric at the expense of growth. Firing your way to a better ratio destroys the growth engine. Revenue per employee should improve because revenue is growing, not because headcount is shrinking. The exception is a genuine restructuring after over-hiring, but even then, the metric improvement is a side effect, not the goal.
Key Takeaways
- Revenue per employee (ARR / FTEs) is the most direct measure of SaaS operational efficiency, benchmarking between $150K and $300K for most private companies.
- The 2026 ICONIQ data shows a widening split: hypergrowth companies are investing in headcount (accepting short-term efficiency loss), while mid-growth companies are cutting to protect margins.
- Always pair revenue per employee with growth rate context. A declining ratio at 100%+ growth means something very different than a declining ratio at 30% growth.
- AI is structurally reshaping this metric by enabling revenue growth without proportional headcount growth, giving early adopters a durable efficiency advantage.
Revenue per employee is one of the first metrics investors check when evaluating whether your SaaS financial model tells a coherent story. If the number does not match your stage benchmarks, the rest of the model becomes harder to defend. Build your headcount and revenue projections in Revenue Map to see how each hire affects your efficiency metrics in real time.
Related Articles
SaaS Gross Margin: How to Calculate and Benchmark It
Learn how to calculate SaaS gross margin, what counts as COGS, and 2026 benchmarks by company stage. Includes a free calculator.
SaaS Rule of 40: How to Calculate and Benchmark It
The Rule of 40 balances SaaS growth rate and profit margin into one benchmark. Learn how to calculate your score, see 2026 benchmarks, and model it.
SaaS Growth Rate Benchmarks: What to Target in 2026
What SaaS growth rate should you target? See 2026 benchmarks by stage, from seed to public, plus formulas and efficiency metrics.