13 Week Cash Flow Forecast: How to Build One
A 13 week cash flow forecast is a week-by-week projection of cash inflows and outflows over the next quarter. Banks and SBA lenders require it to verify short-term liquidity, and business owners use it to spot cash shortfalls two to three months before they hit.
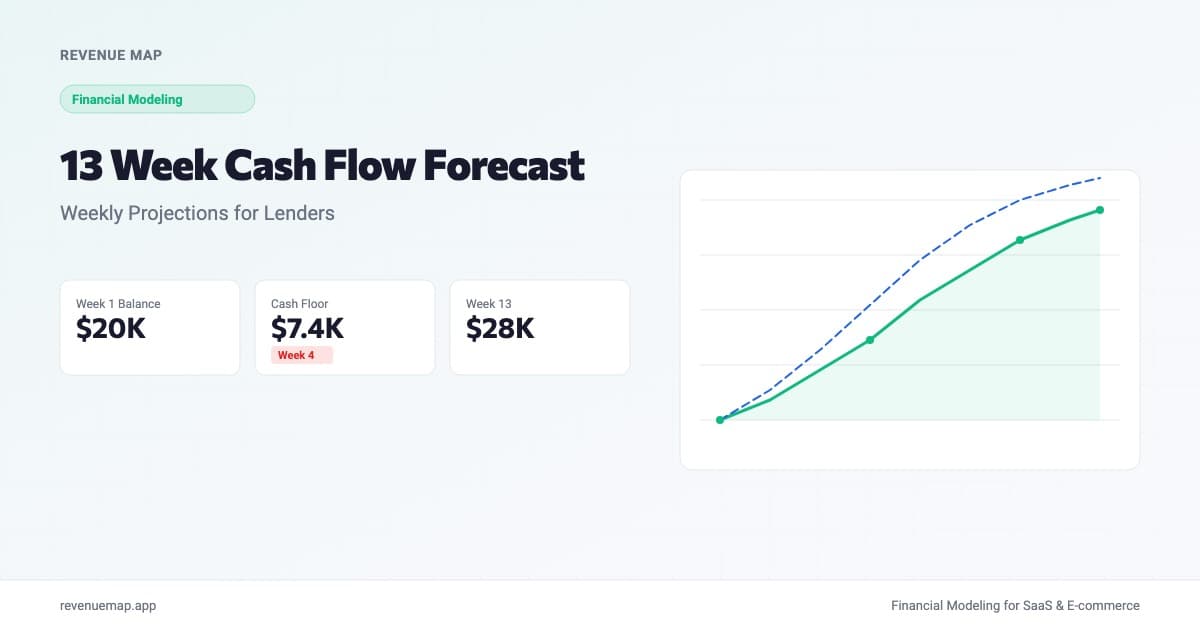
A 13 week cash flow forecast maps your business's cash inflows and outflows on a weekly basis for the next quarter. It answers the question lenders care about most in the short term: will this business have enough cash on hand to cover its obligations every single week for the next 90 days?
This format has become standard in business lending for a reason. When TGI Fridays signed its first U.S. franchise development agreement in a decade with Bliss Bites LLC for five new locations across New York State, each of those restaurants required financing. And every lender evaluating a new restaurant, franchise, or small business loan asks for the same thing: a short-term cash flow forecast that proves the borrower can survive the first quarter of operations, week by week. A 12-month cash flow projection shows annual viability. The 13-week forecast shows whether you make it to month four.
What Is a 13 Week Cash Flow Forecast?
A 13 week cash flow forecast is a rolling, week-by-week projection of every dollar entering and leaving your business over the next quarter. Unlike a monthly projection that averages cash movement across 30 days, the weekly format exposes timing mismatches: payroll hitting on Monday, rent due on the first, a quarterly insurance premium arriving the same week as a slow sales period.
The structure is straightforward. Each row is a cash flow category (revenue, payroll, rent, loan payments, etc.). Each column is one week. The bottom row shows your closing cash balance, which carries forward as the next week's opening balance. If any week's closing balance dips below zero, you know exactly when and why.
Opening Cash Balance (Week 1)
+ Cash Inflows (sales, receivables, loan proceeds)
- Cash Outflows (payroll, rent, COGS, loan payments, taxes)
= Closing Cash Balance (Week 1) → becomes Opening Balance (Week 2)
The term "13 week" comes from a calendar quarter: 52 weeks in a year divided by four equals 13 weeks per quarter. Most lenders treat this as the standard short-term forecast window.
Why Lenders Require a Weekly Forecast
Monthly projections can mask cash crises. A restaurant projecting $45,000 in monthly revenue and $40,000 in monthly expenses looks healthy on paper, with $5,000 in positive cash flow. But zoom into the weeks and the picture can change fast.
Consider a typical restaurant's cash timing:
| Week | Cash In | Cash Out | Net | Running Balance |
|---|---|---|---|---|
| Week 1 | $10,200 | $22,800 | -$12,600 | $7,400 |
| Week 2 | $11,500 | $8,200 | +$3,300 | $10,700 |
| Week 3 | $12,800 | $8,400 | +$4,400 | $15,100 |
| Week 4 | $10,500 | $9,600 | +$900 | $16,000 |
Week 1 is brutal: rent ($8,000), bi-weekly payroll ($12,000), and a supplier invoice ($2,800) all land before the month's revenue has a chance to accumulate. Starting cash of $20,000 drops to $7,400 in a single week. A monthly view would never show that. A lender reviewing that monthly projection would miss the fact that one bad sales week early in the month could push the business into the red.
That is exactly why SBA lenders, bank loan officers, and turnaround advisors require the 13-week format. It forces you to think about when cash arrives, not just how much.
How to Build a 13 Week Cash Flow Forecast
Step 1: Set Your Starting Cash Balance
Pull your actual cash on hand from your bank account on the day you start the forecast. This is not your projected cash or your average balance. Use the real number. If you have multiple accounts, sum them. This becomes the opening balance for Week 1.
Step 2: Map Weekly Cash Inflows
List every source of cash by the week it actually arrives:
- Cash sales. Daily revenue times operating days per week. A restaurant doing $1,800/day over 6 days = $10,800/week. Adjust for known slow periods.
- Accounts receivable. Map to the expected collection date, not the invoice date. A $5,000 catering invoice sent in Week 2 might not clear until Week 5.
- Loan proceeds and other income. Place SBA disbursements, insurance claims, and TI reimbursements in the specific week you expect to receive them.
Step 3: Map Weekly Cash Outflows
Timing matters more than totals:
- Payroll. Most small businesses run bi-weekly payroll. Place the full amount in the weeks it hits (every other week), not spread evenly. A restaurant with $24,000 monthly labor runs roughly $12,000 every other Friday.
- Rent. Full amount in whichever week contains the 1st of each month.
- COGS. Map to your actual delivery and payment cadence (often weekly for restaurants).
- Loan payments. Monthly SBA or bank payments, placed in the week they debit.
- Quarterly and annual spikes. Insurance premiums, estimated taxes, license renewals. These create the cash flow spikes the monthly view averages away.
Step 4: Calculate Weekly Net and Closing Balance
For each week:
Closing Balance = Opening Balance + Total Inflows - Total Outflows
The closing balance carries forward. If Week 3 closes at $8,200, Week 4 opens at $8,200. An error in Week 1 compounds through every subsequent week, so get the starting balance right.
Step 5: Identify the Cash Floor
Scan the 13 weeks for the lowest closing balance: your cash floor. If it is negative, you have a funding gap. If it is uncomfortably close to zero (under one week of operating expenses), that is still a red flag.
Most lenders want a minimum cash balance of at least two weeks of operating expenses at all times. For a business spending $10,000 per week, the forecast should never show a closing balance below $20,000.
Calculate Your 13 Week Cash Position
Weekly Cash Flow Calculator
Estimate your weekly closing cash balance
Want to model this over 36 months with scenarios? Try Revenue Map free →
Plug in your own numbers to see whether a single week runs positive or negative. For the full 13-week rolling picture, build your projections in Revenue Map where the weekly and monthly views stay in sync automatically.
13 Week Forecast vs. 12 Month Projection: When to Use Each
| Feature | 13 Week Forecast | 12 Month Projection |
|---|---|---|
| Time horizon | 90 days | 12 months |
| Interval | Weekly | Monthly |
| Primary purpose | Short-term liquidity | Annual viability |
| Best for | Loan applications, covenant compliance, cash crunch management | Business plans, investor decks, strategic planning |
| Timing detail | Captures weekly spikes (payroll, rent, quarterly taxes) | Averages cash flow across 30-day windows |
| Rolling? | Yes, updated weekly | Typically static or updated quarterly |
| Accuracy expectation | High (near-term data is more reliable) | Moderate (assumptions compound over 12 months) |
Most lenders want both. The 12-month cash flow projection proves the business model works over a year. The 13-week forecast proves the business can survive the next quarter without running out of cash. If you are applying for an SBA loan, your business plan for the loan should include both formats: annual projections in the financial section and a 13-week forecast as a supporting exhibit.
Common Mistakes That Weaken the Forecast
Spreading payroll evenly across four weeks. Bi-weekly payroll means two months per year have three pay periods. If your monthly payroll is $24,000, two months will cost $36,000 in labor. The 13-week forecast should reflect the actual payroll schedule, not a smooth average.
Ignoring collection lag on receivables. If you run a catering operation or B2B food service, the cash from a $10,000 invoice does not arrive the week you send it. Map receivables to the week you realistically expect the check to clear, typically 15 to 45 days after invoicing. Optimistic collection assumptions are the most common way forecasts overstate short-term cash.
Forgetting quarterly expenses. Estimated tax payments (April, June, September, January), quarterly insurance premiums, and annual license renewals create cash spikes that a monthly budget normalizes. In a 13-week window, a $4,000 quarterly tax payment is 4% of a $100,000 quarterly revenue stream, but it hits all at once in a single week.
Using projected revenue instead of conservative estimates. The 13-week forecast is a survival document. Use your trailing four-week average as the revenue baseline, not your growth target. If you are pre-revenue (opening a new location), use 60% to 70% of your projected steady-state revenue for the first four weeks and ramp from there.
Not updating weekly. A 13-week forecast is meant to roll forward. Every Monday, add a new Week 13, replace Week 1 projections with actuals, and adjust the remaining weeks. A static forecast built once and never updated defeats the purpose.
Who Needs a 13 Week Cash Flow Forecast?
Loan applicants. SBA 7(a) and conventional bank loans frequently require a 13-week forecast, especially for new businesses or those with seasonal revenue. If a lender asks for "short-term cash flow projections," this is what they mean.
New brick-and-mortar operators. The first 90 days are the most cash-intensive: build-out costs are spent, inventory is stocked, staff is hired, and revenue is still ramping. A 13-week forecast tells you the exact week you need bridge financing. Knowing your weekly burn rate and break-even point in weekly terms, not just monthly, can be the difference between surviving the ramp and running dry.
Seasonal and turnaround businesses. Any quarter where cash swings dramatically (a slow winter for a beach-town restaurant, a restructuring negotiation with creditors) demands weekly visibility. Turnaround advisors and bankruptcy courts rely on this exact format.
Key Takeaways
- A 13 week cash flow forecast projects cash inflows and outflows weekly for the next quarter, exposing timing risks that monthly projections hide.
- Lenders require it because one bad week can sink a business that looks healthy on a monthly basis. The weekly format shows exactly when and why cash runs short.
- Build it from real data: actual bank balance, actual payroll schedule, actual rent due dates. Spreading expenses evenly across weeks defeats the purpose.
- Update it every week by rolling forward: replace projections with actuals, add a new week at the end, and adjust. A static forecast goes stale fast.
- Most SBA and bank loan applications need both a 13-week forecast (short-term liquidity) and a 12-month projection (annual viability). Pair them in your loan application package.
Need to build your cash flow projections for a lender meeting? Start with Revenue Map's free projection tool. It takes about two minutes, and you can export both the weekly and monthly views your banker is looking for.
Related Articles
Car Wash Startup Costs: Full 2026 Breakdown
Opening a car wash costs $70,000 to $500,000 depending on format. Full cost breakdown for mobile, hand wash, self-service, and tunnel operations.
Laundromat Startup Costs: Full 2026 Breakdown
Opening a laundromat costs $200K to $500K. Full line-by-line breakdown with real equipment prices, build-out costs, and financing options.
Franchise Startup Costs: Full 2026 Breakdown
Franchise startup costs range from $25K to $500K+ depending on the brand and format. Full cost breakdown, comparison table, and financing tips inside.