Customer Lifetime Value: How to Calculate LTV
Customer lifetime value, or LTV, is the total revenue a customer generates over their entire relationship with your business. Calculate it by dividing average revenue per account by your monthly churn rate. For SaaS, a healthy LTV to CAC ratio is 3:1 or higher.
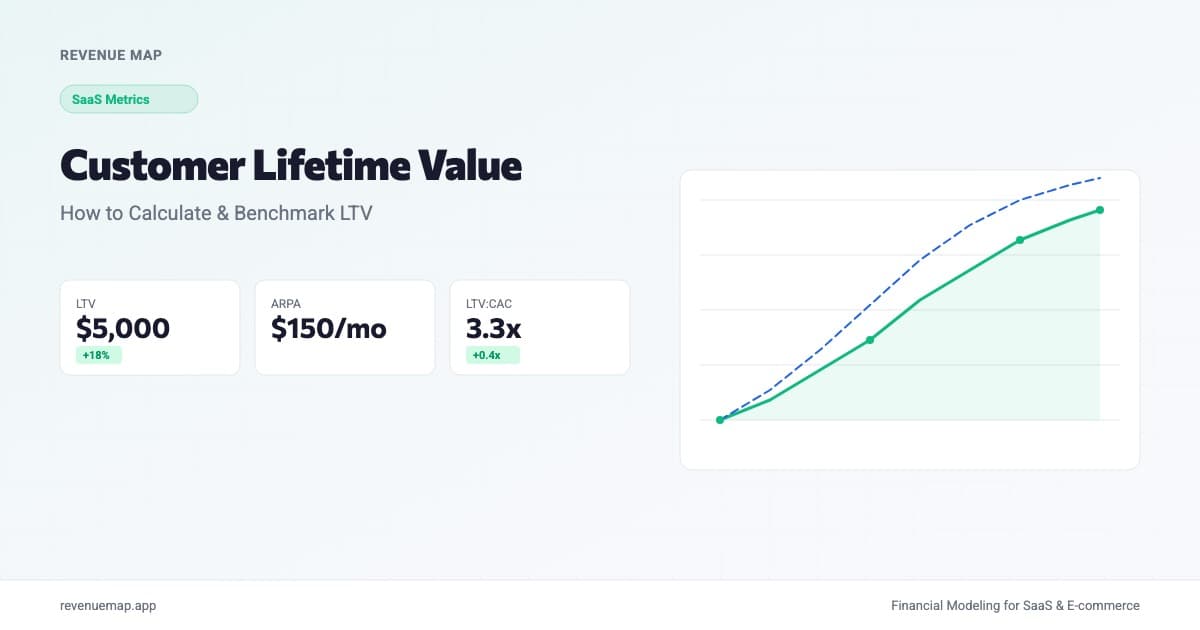
Customer lifetime value (LTV) is the total revenue a customer generates over their entire relationship with your business, adjusted for gross margin. The simplest way to calculate it for a subscription business: divide your average revenue per account by your monthly churn rate. A company with $200 ARPA and 4% monthly churn has an LTV of $5,000 per customer.
That number determines everything downstream. It sets the ceiling on what you can spend to acquire customers, it tells investors whether your unit economics actually work, and it becomes existential when growth slows. SaaStr's recent analysis of "terminal state" software companies paints a stark picture: B2B companies growing below 5% can no longer outrun bad economics. High margins and sticky contracts used to cover for mediocre LTV. Not anymore. When the growth engine stalls, LTV is the number that separates companies with a future from those slowly winding down.
What Is Customer Lifetime Value?
Customer lifetime value is the predicted net profit attributed to the entire future relationship with a customer. It captures three dimensions in a single metric: how long customers stay, how much they pay while they stay, and what it costs you to serve them.
LTV is closely related to two other metrics you're probably already tracking. CAC payback period tells you how long it takes to recover your acquisition investment. The LTV:CAC ratio tells you whether that investment is worthwhile at all. But LTV is the foundation both of those metrics rely on. If your LTV calculation is wrong, your payback and ratio numbers are wrong too.
Here's the thing: LTV is always an estimate. Customers haven't finished being customers yet. You're projecting based on current churn, current ARPA, and current margins. That's fine for planning purposes, but it means you should treat LTV as a range rather than a precise dollar amount, and recalculate it at least quarterly as your inputs shift.
How to Calculate Customer Lifetime Value
There are two common approaches, depending on the precision you need.
The Simple Formula (SaaS and Subscription)
LTV = ARPA / Monthly Churn Rate
Where:
- ARPA is your average revenue per account per month
- Monthly Churn Rate is the percentage of customers who cancel each month (as a decimal)
Worked example: Your SaaS product charges an average of $150/month and your monthly churn rate is 3%.
LTV = $150 / 0.03 = $5,000
Each customer is worth $5,000 over their lifetime. The implicit assumption: a 3% monthly churn rate means an average customer tenure of about 33 months, and 33 months at $150/month equals roughly $5,000.
The Margin-Adjusted Formula
The simple formula uses revenue, but not all revenue is profit. A margin-adjusted version gives you a more honest picture:
LTV = (ARPA x Gross Margin %) / Monthly Churn Rate
Using the same example with 75% gross margins:
LTV = ($150 x 0.75) / 0.03 = $3,750
That $1,250 difference matters. If your CAC is $1,500, the revenue-based LTV gives you a 3.3:1 ratio (looks great), while the margin-adjusted LTV gives you a 2.5:1 ratio (needs work). The margin-adjusted version is what investors want to see.
E-commerce LTV
For non-subscription businesses, the calculation changes:
LTV = AOV x Purchase Frequency x Customer Lifespan x Gross Margin %
A D2C brand with $65 average order value, 4.2 purchases per year, an average customer lifespan of 2.5 years, and 40% gross margins has an LTV of $65 x 4.2 x 2.5 x 0.40 = $273. That's a different ballpark from SaaS, and it shapes a completely different acquisition strategy.
Calculate Your Customer Lifetime Value
LTV Calculator
Calculate customer lifetime value from your ARPA and churn rate
Want to model this over 36 months with scenarios? Try Revenue Map free →
LTV Benchmarks by Business Model
LTV expectations vary dramatically by how you sell and who you sell to. The table below reflects ranges across the current landscape.
| Segment | Below Average | Average | Strong | Elite |
|---|---|---|---|---|
| SMB SaaS (under $1K ACV) | Under $2K | $2K-$5K | $5K-$10K | Over $10K |
| Mid-Market SaaS ($5K-$50K ACV) | Under $15K | $15K-$40K | $40K-$80K | Over $80K |
| Enterprise SaaS ($50K+ ACV) | Under $80K | $80K-$200K | $200K-$500K | Over $500K |
| E-commerce / DTC | Under $80 | $80-$200 | $200-$500 | Over $500 |
| Marketplace (buyer-side) | Under $150 | $150-$400 | $400-$1K | Over $1K |
A few patterns worth noting. Enterprise SaaS commands the highest LTV because contracts are large and net revenue retention rates often exceed 120%, meaning customers expand over time. SMB SaaS runs lower LTV not because the product is less valuable but because smaller businesses churn at structurally higher rates.
E-commerce LTV sits in a different universe entirely. A $200 LTV that costs $60 to acquire is a perfectly healthy business. A $200 LTV in SaaS with $2,000 CAC is a disaster. Always compare LTV to CAC within the same business model, never across them.
Why LTV Matters More When Growth Stalls
The SaaStr piece on terminal-state software companies describes a pattern every founder should model for. For twenty years, B2B software companies that slowed to low single-digit growth could coast on high margins and sticky contracts. The annuity was "forever." That is no longer the assumption.
According to SaaStr, the structural advantage of sticky data and high switching costs is eroding. AI makes it easier to migrate, reformat, and rebuild. The "moat" of structured data locked inside your app is shallower than it used to be.
What does this mean for LTV? Two things.
First, if your growth rate is declining toward the sub-5% zone, your LTV calculation becomes a survival metric rather than just a planning input. Every customer you acquire needs to be profitable on a unit basis because you cannot rely on a growing topline to paper over bad economics. A 2:1 LTV:CAC ratio might work when you're tripling revenue. At 3% growth, it means you're slowly bleeding out.
Second, the assumptions baked into LTV may need revisiting. If switching costs are truly falling, your historical churn rates may understate future churn. Model a scenario where churn increases 20-30% and see what happens to your LTV. If the business still works, you have genuine defensibility. If it doesn't, improving retention is more urgent than you thought.
This is why building LTV as a first-class input in your financial model matters. It should not be a derived number you calculate once and forget. It should be a dynamic assumption you stress-test under different churn and expansion scenarios.
Common LTV Calculation Mistakes
Ignoring Gross Margin
Revenue-based LTV makes every business look better than it is. If your gross margin is 60%, your true LTV is 40% lower than the revenue number suggests. Founders who pitch a "4:1 LTV:CAC" based on revenue and then discover a 2.4:1 ratio on a margin basis have a very different fundraising conversation.
Using Blended Churn
Different customer segments churn at wildly different rates. Segmenting your churn by plan tier, acquisition channel, or customer size will reveal that your "average" LTV is a fiction. Your enterprise customers might have $80K LTV while your starter-plan customers sit at $800. Making acquisition decisions based on the blended number means you're probably overspending on low-LTV segments and underspending on high-LTV ones.
Treating LTV as Static
LTV shifts as your business evolves. Early-stage companies often have artificially high LTV because their first customers are enthusiasts with low churn. As you scale into less motivated segments, churn rises and LTV compresses. Build dynamic LTV projections that account for how retention and ARPA will change as your customer mix shifts.
Ignoring Expansion Revenue
The simple LTV formula assumes flat ARPA over the customer's life. For companies with strong NRR above 100%, ARPA actually grows over time through upsells, seat additions, and usage expansion. If expansion is a meaningful part of your revenue, use a cohort-based LTV calculation that tracks actual revenue per customer over time rather than relying on a snapshot ARPA.
How to Increase Customer Lifetime Value
Three levers move LTV, in order of typical impact:
Reduce churn. Every percentage point of churn reduction compounds across every future month. Dropping monthly churn from 5% to 3% increases average customer tenure from 20 months to 33 months, a 65% improvement in LTV from a single input change. Focus on the first 90 days: that's where most churn concentrates. Better onboarding, faster time-to-value, and proactive outreach to disengaged accounts all pull the churn lever.
Increase ARPA. Pricing adjustments, plan upgrades, add-ons, and usage-based pricing components all push ARPA higher. The key is tying price increases to delivered value so they stick without accelerating churn. A 15% ARPA increase that causes 5% more churn is usually still net positive for LTV, but model it before committing.
Improve gross margins. This lever is slower but durable. Reducing infrastructure costs, automating support, and negotiating better vendor rates all improve the margin-adjusted LTV without touching customer-facing pricing. For companies with margins below 65%, this is often the highest-ROI investment.
Key Takeaways
- Customer lifetime value is the total margin-adjusted revenue a customer generates over their entire relationship, and it sets the ceiling for what you can profitably spend on acquisition
- The core SaaS formula is ARPA times gross margin divided by monthly churn rate, giving you a margin-adjusted LTV that investors and board members expect to see
- A healthy LTV:CAC ratio is 3:1 or higher, but always compare within your business model since SaaS, e-commerce, and marketplace economics differ dramatically
- LTV becomes a survival metric when growth stalls: if you can't outgrow bad unit economics, every customer must be individually profitable
- Reduce churn for the highest-leverage LTV improvement since a small churn reduction compounds across every future month of the customer relationship
Your LTV determines how much you can invest in growth and still come out ahead. Model it alongside your full unit economics in Revenue Map to see how changes in churn, pricing, and margins shift your trajectory over 12, 24, and 36 months.
Related Articles
SaaS Unit Economics: Formulas and Benchmarks (2026)
Calculate SaaS unit economics with formulas for CAC, LTV, contribution margin, and payback. Includes 2026 benchmarks by stage and a free calculator.
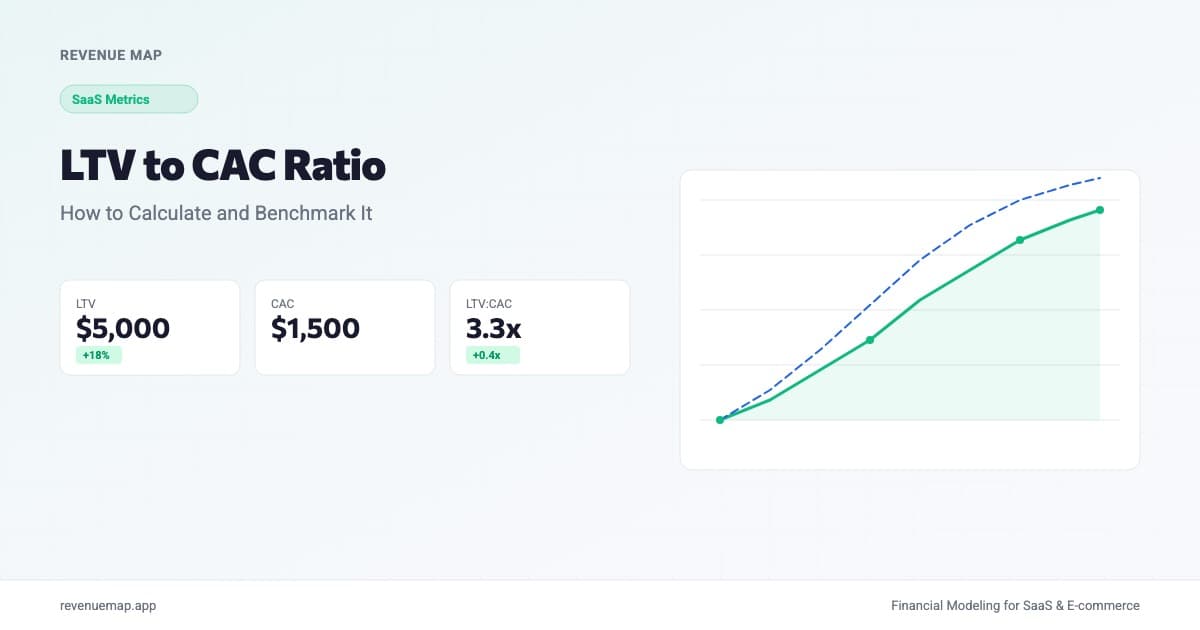
LTV to CAC Ratio: How to Calculate and Benchmark It
Learn how to calculate your LTV to CAC ratio, see what good looks like by stage and channel, and use it to make smarter growth spending decisions.
CAC Payback Period: How to Calculate and Benchmark It
Learn how to calculate your CAC payback period, see 2026 benchmarks by company stage, and find strategies to shorten it.