SaaS Unit Economics: Formulas and Benchmarks (2026)
SaaS unit economics measure the revenue and cost associated with acquiring and serving a single customer. The core metrics are customer acquisition cost, lifetime value, contribution margin, and CAC payback period. A healthy SaaS business targets an LTV to CAC ratio of 3 to 1 or higher and a CAC payback period under 18 months.
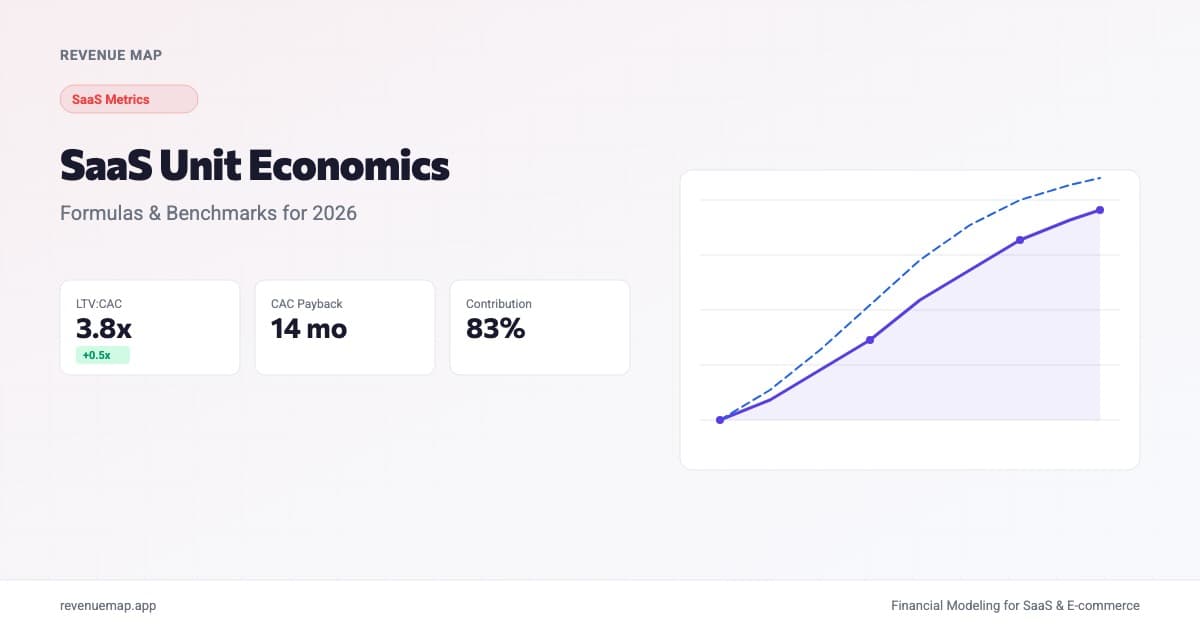
SaaS unit economics are the per-customer revenues and costs that tell you whether your subscription business is building value or quietly destroying it with every new signup. The four metrics that define this are customer acquisition cost (CAC), customer lifetime value (LTV), contribution margin, and CAC payback period. Get these right and you can scale confidently. Get them wrong and growth just accelerates the problem.
This matters more now than it did two years ago. SaaStr recently covered how one company churned Notion after seven years because an AI agent took over the last job Notion served. When AI can displace an entrenched tool with zero support tickets and zero complaints, every SaaS founder needs to stress-test the LTV assumptions behind their own unit economics.
What Are SaaS Unit Economics?
SaaS unit economics measure the direct revenues and costs associated with acquiring and retaining a single subscription customer, used to determine whether the business model is fundamentally profitable at the customer level.
This is different from looking at your P&L. A SaaS company can post impressive top-line ARR growth while its unit economics are deeply negative, spending $15,000 to acquire enterprise customers who churn after 10 months and generate $8,000 in lifetime gross profit. That gap doesn't show up on a revenue chart. It shows up in your bank account 18 months later.
For SaaS specifically, unit economics differ from e-commerce unit economics in a few important ways. Subscription revenue is recurring, which means LTV compounds with retention. Gross margins are typically higher (70-85% vs. 30-50% for e-commerce). And the cost structure is front-loaded: you spend heavily to acquire a customer and then earn back that investment over months or years of subscription payments.
The Four Metrics That Define SaaS Unit Economics
Customer Acquisition Cost (CAC)
CAC is the total cost of sales and marketing required to acquire one new paying customer.
CAC = Total Sales & Marketing Spend / New Customers Acquired
Include everything: paid ads, SDR salaries, sales commissions, marketing headcount, tooling costs, content production, and event spend. The most common mistake is excluding headcount. A team of four SDRs at $75K each is $300K per year in acquisition cost that belongs in the denominator.
If your company spent $180,000 on sales and marketing last quarter and acquired 120 new customers, your CAC is $1,500.
Customer Lifetime Value (LTV)
LTV is the total gross profit a customer generates over the full duration of their subscription.
LTV = ARPU / Monthly Churn Rate × Gross Margin %
The gross margin multiplier is the piece most founders skip. Without it, you're calculating revenue per customer, not profit per customer. At 80% gross margins and $50 ARPU with 3% monthly churn, the difference is significant:
Revenue LTV = $50 / 0.03 = $1,667
Gross-Profit LTV = $50 / 0.03 × 0.80 = $1,333
That $334 gap changes how much you can afford to spend on acquisition. Use gross-profit LTV in every acquisition decision. Revenue LTV belongs nowhere near a CAC comparison. For a deeper breakdown of LTV calculations and common pitfalls, see our LTV to CAC ratio guide.
LTV:CAC Ratio
The ratio that ties acquisition and retention together:
LTV:CAC Ratio = LTV / CAC
| Ratio | What It Means |
|---|---|
| Under 1:1 | Losing money on every customer. Growth accelerates the problem. |
| 1:1 to 3:1 | Marginal. Covering acquisition cost but leaving little for R&D, G&A, and profit. |
| 3:1 | The benchmark. $3 in lifetime gross profit for every $1 spent acquiring. |
| Above 5:1 | Strong economics, but possibly underinvesting in growth. |
CAC Payback Period
How many months until a customer has generated enough gross profit to cover their acquisition cost:
CAC Payback (months) = CAC / (ARPU × Gross Margin %)
If your CAC is $1,500, your ARPU is $100/month, and your gross margin is 80%, your payback period is:
$1,500 / ($100 × 0.80) = 18.75 months
That means you need the customer to stay for at least 19 months before you break even on the acquisition spend. CAC payback period is often more useful than LTV:CAC for cash flow planning because it tells you how long your capital is locked up before you see a return.
How to Calculate SaaS Contribution Margin
Contribution margin is the percentage of each subscription dollar that remains after subtracting the variable costs of serving that customer. It sits between revenue and gross margin in the unit economics stack.
Contribution Margin = (ARPU - Variable Cost per Customer) / ARPU × 100
Variable costs in SaaS typically include hosting and infrastructure (per-customer compute, storage, bandwidth), customer support (tickets, chat), payment processing fees (2.5-3.5% of revenue), and third-party API costs that scale with usage.
Worked example, Acme SaaS: Acme sells a $120/month project management tool. Their per-customer variable costs are:
- Hosting: $8/month
- Support allocation: $6/month
- Payment processing (3%): $3.60/month
- Third-party APIs: $2.40/month
- Total variable cost: $20/month
Contribution Margin = ($120 - $20) / $120 × 100 = 83.3%
Most healthy SaaS businesses target contribution margins above 75%. Below 65% suggests either your pricing is too low or your per-customer infrastructure costs need attention.
SaaS Unit Economics Calculator
Enter your SaaS metrics to calculate LTV, LTV:CAC ratio, and CAC payback period
SaaS Unit Economics Benchmarks by Stage
Benchmarks shift significantly depending on company stage. A seed-stage company with a 24-month CAC payback is normal. A Series C company with the same number has a problem.
| Metric | Seed | Series A | Series B+ |
|---|---|---|---|
| LTV:CAC Ratio | 2-3x | 3-4x | 4x+ |
| CAC Payback | 18-24 months | 12-18 months | Under 12 months |
| Gross Margin | 65-75% | 70-80% | 78-85% |
| Monthly Logo Churn | 3-5% | 2-3% | Under 2% |
| Net Revenue Retention | 90-100% | 100-110% | 110%+ |
These benchmarks assume a self-serve or inside-sales motion. Enterprise SaaS with field sales will have higher CAC but should also have lower churn and higher ARPU, which can produce strong LTV:CAC ratios despite the elevated acquisition cost. Track your monthly recurring revenue alongside these metrics to see how the numbers move together over time.
How AI Is Changing SaaS Unit Economics
Two forces are reshaping these formulas simultaneously.
For SaaS vendors, AI increases substitution risk. The SaaStr article about churning Notion captures something broader: when AI agents can replicate the core job a SaaS product does, the switching cost drops to near zero. Seven years of usage, zero complaints, and still the product got replaced. That compresses the customer lifespan assumption in your LTV formula. If you're modeling a 36-month average customer lifetime and AI substitutes start appearing in your category, you should be running scenarios at 24 months and 18 months to see how your unit economics hold up.
Meanwhile, a solo founder recently used Codex and ChatGPT to launch an entire fashion brand without engineers, according to Lenny's Newsletter. That kind of AI-enabled building reduces the barrier to entry across SaaS categories, which means more competitors, more churn risk, and more pressure on differentiation.
For SaaS buyers, AI can improve unit economics. AI-powered outbound tools reduce CAC by automating prospecting and personalization at scale. AI support agents lower the variable cost per customer, improving contribution margin. And AI-assisted onboarding can shorten time-to-value, which improves trial conversion and reduces early churn.
The practical takeaway: stress-test your LTV assumptions. Run your unit economics model with a 20-30% reduction in average customer lifespan and see whether the business still works. If it does, you have resilient economics. If it doesn't, focus on building moats (data, integrations, network effects) that make AI substitution harder.
Common SaaS Unit Economics Mistakes
1. Blending CAC across channels. A blended CAC of $800 can hide a paid search CAC of $2,200 and an organic CAC of $150. Those two channels need completely different strategies. Always decompose CAC by channel before making budget decisions.
2. Ignoring expansion revenue in LTV. If your net revenue retention is above 100%, your customers are worth more over time than the initial subscription suggests. Standard LTV formulas that use only initial ARPU understate the value of customers who expand. For businesses with strong upsell motions, calculate LTV using a revenue retention rate that includes expansion.
3. Using annual churn when you should use monthly. A 25% annual churn rate sounds manageable. But 25% annual churn is roughly 2.4% monthly churn, which means your average customer lifetime is about 42 months. Plugging annual churn directly into a monthly ARPU formula produces wildly incorrect LTV calculations.
4. Treating CAC payback as static. CAC payback changes as you scale. Early customers often come from founder-led sales with artificially low CAC. When you hire an SDR team and ramp paid channels, CAC rises, sometimes dramatically. Model your payback period at your projected CAC for the next 12 months, not at today's number.
Key Takeaways
- SaaS LTV formula: ARPU / Monthly Churn Rate x Gross Margin %. Always use gross-profit LTV, not revenue LTV, when comparing against CAC
- Target a 3:1 LTV:CAC ratio as the baseline; below 1:1 means every new customer destroys value
- CAC payback under 18 months for seed-stage companies, under 12 months at Series B and beyond; longer payback periods strain working capital
- Contribution margins above 75% indicate healthy per-customer economics; below 65% signals a pricing or infrastructure problem
- AI is compressing customer lifespans in some SaaS categories by reducing switching costs; stress-test your LTV with 20-30% shorter lifetime assumptions
- Always decompose CAC by channel and include expansion revenue in LTV for businesses with net revenue retention above 100%
A financial model is a living document. The best SaaS founders revisit their unit economics monthly, update assumptions as cohort data comes in, and adjust growth spending accordingly. Revenue Map's SaaS financial model template lets you adjust churn, ARPU, CAC, and expansion in one place and see how each lever moves your unit economics. Start building yours now.
Related Articles
LTV to CAC Ratio: How to Calculate and Benchmark It
Learn how to calculate your LTV to CAC ratio, see what good looks like by stage and channel, and use it to make smarter growth spending decisions.
Customer Lifetime Value: How to Calculate LTV
Learn how to calculate customer lifetime value (LTV) with formulas, benchmarks by segment, and strategies to increase it for SaaS and e-commerce.
CAC Payback Period: How to Calculate and Benchmark It
Learn how to calculate your CAC payback period, see 2026 benchmarks by company stage, and find strategies to shorten it.