AI Startup Unit Economics: Costs, Margins, Benchmarks
AI startup unit economics measure the per-unit cost of delivering AI-powered features, primarily driven by GPU compute and inference costs. The core metrics are cost per inference, AI COGS ratio, gross margin after compute, and LTV to compute-adjusted CAC ratio. Healthy AI startups target 50 to 70 percent gross margin after compute costs.
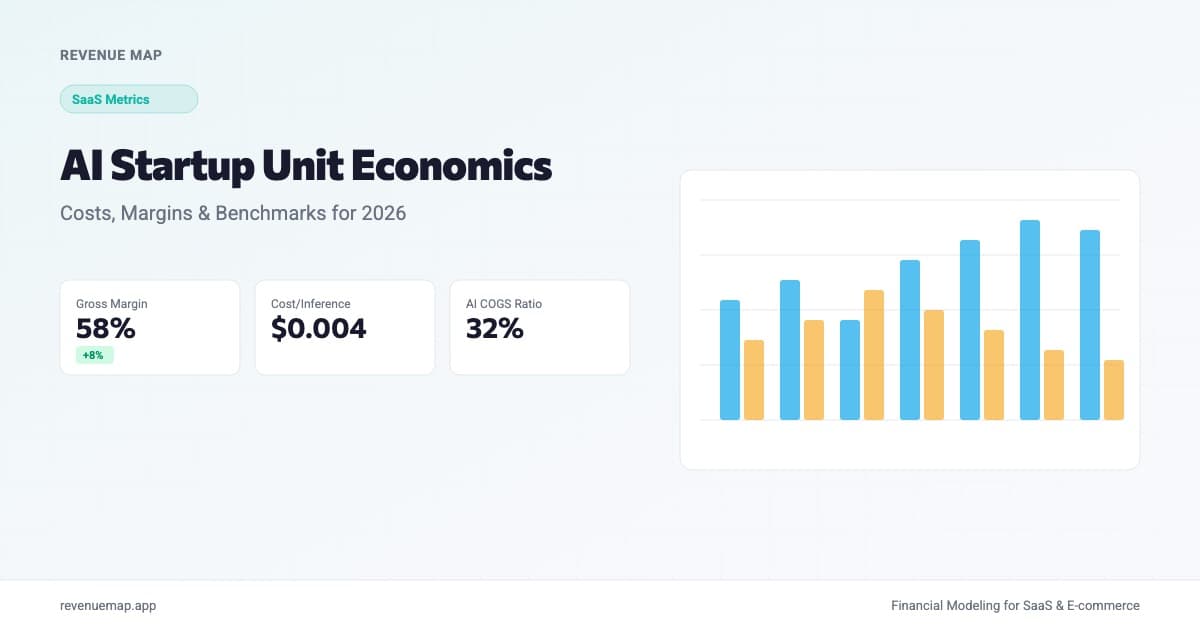
AI startup unit economics are the per-unit revenues and costs of delivering AI-powered products, and they work fundamentally differently from traditional SaaS. While a conventional SaaS product has near-zero marginal cost per user, every AI inference burns GPU compute that shows up directly in your cost of goods sold. The five metrics that define AI unit economics are cost per inference, AI COGS ratio, gross margin after compute, compute-adjusted LTV, and the LTV to compute-adjusted CAC ratio.
Getting these numbers right matters more in 2026 than ever. According to SaaStr's latest analysis, only seven public B2B software companies are growing faster than 30% year over year. In the AI-native cohort, 30% growth would be last place. That velocity is exciting, but it's meaningless if every new user degrades your margin. Growth without unit economics is just a more expensive way to lose money.
What Makes AI Unit Economics Different from SaaS?
The short version: marginal cost. In traditional SaaS unit economics, serving one more user costs almost nothing. AI products flip that. Every model inference burns GPU compute. If a customer makes 50 API calls per day at $0.008 each, that's $12/month in pure compute for a single user. Scale to 10,000 users and you're at $120,000/month on inference alone.
Three structural differences matter:
| Factor | Traditional SaaS | AI-Native Product |
|---|---|---|
| Marginal cost per user | Near zero ($1-5/mo) | Significant ($5-50/mo) |
| Gross margin range | 75-85% | 40-70% |
| COGS driver | Hosting, support | GPU compute, inference |
| Cost scaling | Sub-linear with users | Linear to super-linear with usage |
| Pricing sensitivity | Low (flat per-seat) | High (must track usage patterns) |
You cannot bolt AI features onto a SaaS pricing model and expect the economics to work.
The Five Core AI Unit Economics Metrics
1. Cost Per Inference
Cost per inference is the fully loaded cost of serving a single AI model call.
Cost Per Inference = Total GPU Compute Cost / Total Inferences Served
Include GPU instance costs, model loading overhead, data transfer, and any third-party API fees. Cost per inference varies dramatically: a fine-tuned classifier might cost $0.0001 per call while a large language model runs $0.01-0.05.
Worked example: Your AI writing assistant uses a hosted LLM API at $0.002 per 1K input tokens and $0.008 per 1K output tokens. Average query: 200 input tokens, 500 output tokens.
Input cost  = (200 / 1000) x $0.002 = $0.0004
Output cost = (500 / 1000) x $0.008 = $0.004
Cost per inference = $0.0044
At 40 queries per user per day, that's $5.28 per user per month in inference cost. For a $29/month product, 18% of revenue goes to compute.
2. AI COGS Ratio
AI COGS ratio measures what percentage of your revenue goes directly to compute costs. It's the AI-native equivalent of cost of goods sold.
AI COGS Ratio = Total Compute Cost / Total Revenue × 100
This metric tells you how much room you have for everything else: engineering, sales, G&A, and profit. A 40% AI COGS ratio means 60 cents of every dollar is available for non-compute expenses. Compare that to traditional SaaS, where COGS typically consumes only 15-25% of revenue.
Track this monthly and watch the trend. If your AI COGS ratio is rising as you grow, you have a scaling problem that will eventually cap your growth or destroy your margins.
3. Gross Margin After Compute
This is the metric investors actually care about. It answers: after you pay for the GPU compute required to serve your product, what's left?
Gross Margin After Compute = (Revenue - All COGS Including Compute) / Revenue × 100
Include everything in COGS: GPU compute, hosting, data storage, third-party APIs, support costs, and payment processing. The key difference from standard gross margin calculations is that compute costs often dominate the COGS line.
| AI Product Category | Typical Gross Margin After Compute |
|---|---|
| LLM API wrappers (thin layer over OpenAI/Anthropic) | 30-50% |
| AI-enhanced SaaS (proprietary model + software) | 55-70% |
| Code assistants | 60-75% |
| Data analytics / BI with AI | 60-75% |
| Image / video generation | 45-60% |
| Conversational AI / chatbots | 50-65% |
If your product is primarily a UI layer on a third-party model API, your margin is structurally capped by the provider's pricing. Price changes flow directly to your P&L, and your competitors see the same benefit from any cuts. Building on rented inference works, but it puts a ceiling on your unit economics.
4. Compute-Adjusted LTV
Standard LTV calculations use gross margin to convert revenue into profit. For AI products, you need to be more precise because compute costs vary significantly by customer.
Compute-Adjusted LTV = (ARPU - Compute Cost Per User) / Monthly Churn Rate
Instead of applying a flat gross margin percentage, you subtract actual compute cost per user. This matters because a power user making 200 API calls per day costs 10x more to serve than a casual user making 20.
Worked example: AI analytics tool at $99/month, $22/month compute cost, 4% monthly churn:
Compute-Adjusted LTV = ($99 - $22) / 0.04 = $1,925
Standard LTV (70% GM) = $99 x 0.70 / 0.04 = $1,733
That gap compounds across your base and changes LTV to CAC ratio decisions.
5. LTV:Compute-Adjusted CAC Ratio
LTV:CAC = Compute-Adjusted LTV / CAC
Target at least 3:1, same as traditional SaaS. But getting there is harder because compute costs compress your LTV. A SaaS company with 80% gross margin keeps $80 of every $100 ARPU. An AI company at 55% keeps only $55. To hit the same LTV, you need lower churn, higher ARPU, or lower CAC.
How to Calculate Your AI Unit Economics
AI Unit Economics Calculator
Calculate your cost per inference and gross margin after compute
Want to model this over 36 months with scenarios? Try Revenue Map free →
Step-by-Step Process
Step 1: Measure inference volume. Log every model call for 30+ days. Group by customer segment because usage patterns differ dramatically between free and enterprise tiers.
Step 2: Calculate true cost per inference. Include idle GPU time, data transfer, and preprocessing overhead, not just the API sticker price. For self-hosted models, amortize hardware over 3-4 years.
Step 3: Build per-customer compute cost. Multiply average inferences per user per day by cost per inference by 30 days. Segment by plan tier.
Step 4: Calculate gross margin by segment. If your highest-paying customers also have the worst unit economics, you have a pricing architecture problem that volume won't fix.
How to Improve AI Unit Economics
Not every AI startup needs 70% gross margin from day one. But you need a credible path to getting there. Five levers actually move the needle:
Caching and deduplication. Semantic caching (matching intent, not exact strings) can reduce inference volume by 20-25% when a significant portion of queries are similar.
Model distillation. Train a smaller model on your larger model's outputs for common cases. Route simple queries to the distilled model, reserve the expensive one for edge cases. This can cut compute costs 40-60%.
Batching inference requests. Processing multiple requests in a single GPU pass reduces per-inference costs by 30-50%, depending on latency requirements.
Usage-based pricing alignment. Flat-rate pricing on AI products often means your heaviest users have the worst unit economics. Tiered limits or hybrid pricing can realign revenue with cost. See our guide to per-seat vs. usage-based pricing for the trade-offs.
Vertical specialization. Domain-specific models are smaller, cheaper to run, and often outperform general-purpose models in their niche. Specialization improves both margins and differentiation.
AI Unit Economics Benchmarks for 2026
The benchmarks below are drawn from publicly available data and typical ranges for venture-backed AI startups. Use them as directional guidance, not hard targets. Your specific numbers will depend on model architecture, pricing strategy, and customer base.
| Metric | Seed Stage | Series A | Series B+ |
|---|---|---|---|
| Cost per inference | $0.003-0.02 | $0.001-0.01 | Under $0.005 |
| AI COGS ratio | 35-50% | 25-40% | Under 30% |
| Gross margin after compute | 40-55% | 50-65% | 60-70%+ |
| Compute-adjusted LTV:CAC | 2-3x | 3-4x | 4x+ |
| Monthly churn | 4-6% | 2-4% | Under 2% |
| Burn rate as % of revenue | 150-300% | 80-150% | Under 80% |
At seed stage, high AI COGS is tolerable while you find product-market fit. By Series B, investors expect a clear path to 60%+ gross margin.
The gap between AI-native and traditional B2B SaaS is visible in the margin profiles. Those seven public B2B companies growing above 30% maintain gross margins of 70-85%. AI-native companies growing faster often operate at 45-65% gross margin. Unit economics determine whether that growth creates enterprise value or just enterprise spend.
Common Mistakes in AI Unit Economics
1. Ignoring usage variance across segments. Your top 10% of users might account for 60% of compute costs. Blended averages hide this. Always segment by tier.
2. Treating API costs as fixed. Third-party model pricing changes frequently. If your margins only work at today's API prices, you have a fragile business. Model scenarios for both increases and decreases.
3. Skipping compute cost in LTV. Using a standard 80% SaaS gross margin when your actual margin is 55% overstates LTV by 45%. That error cascades into every acquisition and growth spending decision.
Key Takeaways
- AI unit economics differ from SaaS because every inference costs real GPU compute, making marginal cost per user significant rather than negligible
- Cost per inference is your atomic metric: total GPU compute cost divided by total inferences served, including idle time, data transfer, and preprocessing
- Target 50-70% gross margin after compute by Series A; seed-stage companies can tolerate 40-55% while optimizing for product-market fit
- Segment unit economics by customer tier because power users can cost 5-10x more to serve, and blended averages hide pricing problems
- Five levers improve margins: caching (20-25% compute reduction), model distillation (40-60%), batching (30-50%), usage-based pricing, and vertical specialization
- Build your AI startup financial model with compute cost as a first-class variable, not a hosting line item
The founders who win in AI will be the ones who grow fast with clear unit economics. Revenue Map's AI/ML financial model template lets you plug in your inference costs, usage patterns, and pricing to see exactly where your margins land. Start building yours now.
Related Articles
SaaS Gross Margin: How to Calculate and Benchmark It
Learn how to calculate SaaS gross margin, what counts as COGS, and 2026 benchmarks by company stage. Includes a free calculator.
SaaS Unit Economics: Formulas and Benchmarks (2026)
Calculate SaaS unit economics with formulas for CAC, LTV, contribution margin, and payback. Includes 2026 benchmarks by stage and a free calculator.
LTV to CAC Ratio: How to Calculate and Benchmark It
Learn how to calculate your LTV to CAC ratio, see what good looks like by stage and channel, and use it to make smarter growth spending decisions.