Annual Contract Value: How to Calculate and Model ACV
Annual contract value, or ACV, is the annualized revenue from a single customer contract, excluding one-time fees. Calculate it by dividing total contract value by contract length in years. SaaS benchmarks range from $1,000 to $5,000 for self-serve SMB up to $250,000 or more for enterprise deals.
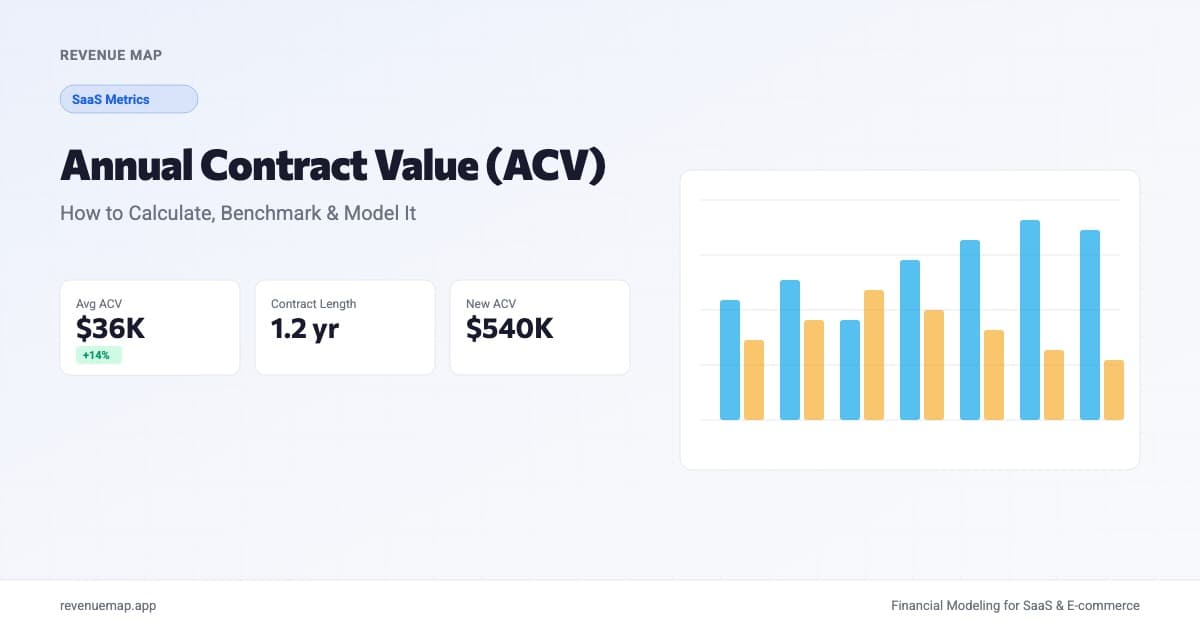
Annual contract value (ACV) is the annualized revenue a single customer contract generates, excluding one-time fees like setup or implementation charges. Calculate it by dividing the total contract value by the number of years in the contract. For most SaaS companies, ACV ranges from $5,000 for SMB products to well over $100,000 for enterprise deals, and this metric sits at the center of how you forecast revenue, plan sales capacity, and communicate growth to investors.
The way founders think about ACV is shifting. SaaStr's latest analysis argues that multi-year contracts have become harder to justify in the age of AI, where buyer behavior favors flexibility and shorter commitments. That means more of your bookings land as 12-month deals rather than two or three-year agreements, which changes how ACV flows through your financial model and what benchmarks actually apply.
What Is Annual Contract Value?
Annual contract value is the average annualized revenue per customer contract, normalized to a single year. It strips out one-time charges (setup, implementation, training) so you can compare deals of different lengths on a consistent basis.
Here is the distinction that trips people up: ACV is not the same as ARR (annual recurring revenue). ARR is an aggregate number reflecting total recurring revenue across all active customers, annualized. ACV is per-deal. If you close a three-year contract worth $90,000, your ACV on that deal is $30,000. When that deal becomes active, it contributes $30,000 to your ARR.
ACV also differs from total contract value (TCV), which represents the full value of the contract across its entire term. A $90,000 three-year deal has a TCV of $90,000 and an ACV of $30,000. Investors and board members care about both numbers, but ACV is the one that plugs directly into your revenue model because it represents what you can expect to collect in any given year.
How to Calculate ACV
The core formula:
ACV = Total Contract Value / Contract Length (years)
For contracts that include one-time fees, strip those out first:
ACV = (Total Contract Value - One-Time Fees) / Contract Length (years)
Worked example: Your startup closes an enterprise deal worth $120,000 over two years, with a $10,000 implementation fee. The ACV is ($120,000 - $10,000) / 2 = $55,000. That $55,000 flows into your revenue forecast each year. The $10,000 implementation fee gets recognized separately, often as professional services revenue.
For your entire customer base, average ACV tells you the typical deal size:
Average ACV = Total New ACV Booked / Number of New Deals
This average is what you use when building a SaaS financial model to project future revenue from your sales pipeline. It connects your sales capacity (reps, quotas, close rates) to the ARR you expect to add each quarter.
Calculate Your ACV
ACV Calculator
Calculate the annualized value of a customer contract
Want to model this over 36 months with scenarios? Try Revenue Map free →
ACV Benchmarks by Stage and Segment
ACV varies enormously depending on who you sell to. The table below reflects current ranges for SaaS and software companies.
| Segment | Typical ACV Range | Sales Motion | Typical Contract Length |
|---|---|---|---|
| Self-Serve SMB | $1K - $5K | Product-led growth | Monthly or annual |
| Mid-Market | $15K - $50K | Inside sales | 1 year |
| Enterprise | $50K - $250K | Field sales | 1-2 years |
| Strategic / Large Enterprise | $250K - $1M+ | Named accounts | 1-3 years |
A few things to notice. ACV correlates strongly with sales cycle length and cost of acquisition. Closing a $200K deal requires a fundamentally different go-to-market motion than a $3K self-serve signup. Your CAC payback period naturally stretches as ACV grows, but so does net revenue retention, which compensates over time through expansion revenue and lower churn.
Second, the same company often has multiple ACV tiers. A startup selling a $2,000/year starter plan alongside a $50,000/year enterprise plan has two distinct unit economics profiles. Blending them into one ACV number obscures more than it reveals. When building your model, track ACV by pricing tier or customer segment separately.
Why Contract Length Is Shifting
The SaaStr piece makes a pointed argument: most B2B SaaS companies should stop pushing for multi-year contracts. According to SaaStr, shorter contracts have become the norm across B2B and AI, and this reflects rational buyer behavior rather than something to fight against.
What does this mean for your ACV model? Three practical implications.
ACV becomes simpler but loses its cash-flow advantage. When most contracts run 12 months, your ACV equals the annual subscription price. No more dividing three-year deals to normalize them. The trade-off: you lose the benefit of collecting two or three years of cash upfront, which affects your runway planning directly.
Renewal cohorts grow faster. Annual contracts mean every customer hits a renewal decision within 12 months. Your churn rate becomes visible sooner, and your NRR math has a shorter feedback loop. That is genuinely useful for founders who want to iterate quickly on retention and expansion strategies.
Expansion revenue carries more weight. Without multi-year lock-in inflating TCV, your ACV growth has to come from upsells, cross-sells, and usage increases. Companies with strong ARPU expansion through usage-based components, seat growth, or tier upgrades will outperform those that relied on longer contract commitments to boost deal size.
How to Model ACV in Your Financial Plan
In a SaaS financial model, ACV is the bridge between your sales capacity and your revenue forecast. The core relationship:
New ARR = New Deals x Average ACV
Revenue growth is a function of two levers: how many deals your team closes and how large those deals are. Most founders focus on deal count, but ACV improvements compound just as powerfully. Raising average ACV from $20,000 to $24,000 (a 20% increase) has the same impact on new ARR as hiring 20% more sales reps, at far lower cost.
When projecting ACV forward, account for three forces:
- Pricing changes. A 10% price increase next year raises new-deal ACV accordingly. Existing customers may stay at legacy pricing until renewal, creating a lag between the price change and the portfolio-wide ACV impact.
- Mix shift. As your product matures, the share of enterprise deals typically grows, pulling average ACV upward. But launching a self-serve tier shifts the blend down even as total bookings increase. Model these segments independently.
- Contract length changes. Following SaaStr's recommendation and shifting from multi-year to annual contracts keeps your ACV per deal the same but reduces TCV. Your cash collection timeline changes, which feeds directly into your pricing strategy and cash flow assumptions.
Build these assumptions into separate rows in your model so you can stress-test each one independently. A scenario where ACV grows 15% through pricing but drops 10% through mix shift tells a very different story than flat ACV across the board.
Common Mistakes When Working with ACV
Including One-Time Fees
Setup, implementation, and training charges inflate your ACV if you include them. These are non-recurring by definition. Strip them out before calculating, or you will overstate the recurring revenue each customer generates and distort your revenue projections.
Confusing ACV with ARR
ACV is a per-deal metric. ARR is a portfolio metric. Adding a $50,000 ACV deal increases your ARR by $50,000, but the two numbers answer different questions. ACV tells you about deal quality and sales efficiency. ARR tells you about business scale and total revenue. Report both, but do not use them interchangeably in your model or your board deck.
Ignoring Segment Differences
A blended ACV of $25,000 might represent a business where every customer pays roughly $25,000. Or it might represent one where half pay $5,000 and half pay $45,000. The operational implications are completely different: sales capacity, onboarding costs, support burden, and churn dynamics all diverge. Segment by tier, industry, or customer size and track ACV trends within each group.
Key Takeaways
- Annual contract value normalizes contracts of different lengths into a yearly figure, making it the standard unit for comparing deals and building revenue forecasts
- Calculate ACV by dividing total contract value (minus one-time fees) by contract length in years, and segment it by customer tier to avoid misleading blended averages
- ACV benchmarks range from $1K-$5K for self-serve SMB up to $250K+ for enterprise, with each tier requiring a fundamentally different sales motion and cost structure
- The shift toward shorter contracts means ACV increasingly equals annual subscription price, putting more pressure on expansion revenue and NRR to drive growth
- In your financial model, New ARR = New Deals x Average ACV, so improvements in deal size compound just as powerfully as increases in deal volume
Understanding your ACV is the first step. The real leverage comes from modeling how it flows through your revenue forecast, cost structure, and cash runway over time. Build your ACV-driven financial model in Revenue Map to see how deal-size changes ripple through every layer of your plan.
Related Articles
SaaS Revenue Per Employee: 2026 Benchmarks
How much ARR should each employee generate? See 2026 SaaS revenue per employee benchmarks by stage and growth rate, with formulas and a free calculator.
SaaS Gross Margin: How to Calculate and Benchmark It
Learn how to calculate SaaS gross margin, what counts as COGS, and 2026 benchmarks by company stage. Includes a free calculator.
SaaS Cash Collection Rate: How to Track It
Cash collection rate measures how much of your invoiced MRR you actually receive. Learn how to calculate it, benchmark it, and close the gap.