Cash Flow Statement Example for Your Business Plan
A cash flow statement shows the actual movement of cash into and out of a business each month. It includes three sections: operating activities, investing activities, and financing activities. For a business plan, lenders use it to confirm the business can cover expenses and loan payments from operations.
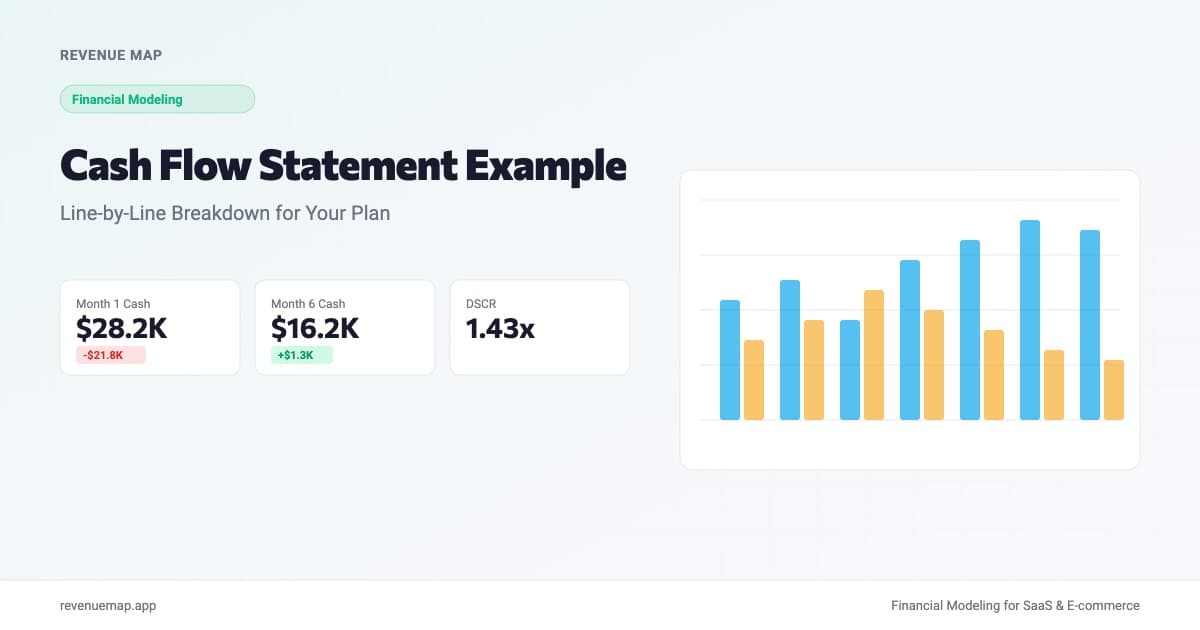
A cash flow statement example shows the actual movement of money into and out of your business, month by month, in the format lenders and partners expect to see. Below you will find a complete six-month example with real numbers for a coffee shop, a breakdown of every line item, and a calculator to estimate your own figures. If you are building financial projections for a business plan, this is the document that proves your business can cover its bills.
Getting this right matters heading into late 2026. Consumer spending patterns keep shifting, with Small Business Trends recently identifying seven key trends reshaping how customers buy. Those shifts affect your revenue timing, your seasonal assumptions, and ultimately the sample cash flow projection inside your plan. A statement built on last year's traffic patterns may not hold up.
What Is a Cash Flow Statement?
A cash flow statement is a financial document that tracks every dollar of actual cash entering and leaving your business during a set period. Unlike a profit and loss statement, which records revenue when it is earned (even if the check has not arrived), a cash flow statement only counts money that has changed hands.
For a small business owner writing a business plan, this distinction matters more than it sounds. You might book $30,000 in revenue in March, but if half your customers pay on net-30 terms, only $15,000 reaches your bank account that month. Your cash flow statement captures that lag. Your P&L does not.
Most cash flow statements split into three sections:
| Section | What It Tracks | Why It Matters |
|---|---|---|
| Operating Activities | Sales, payroll, rent, supplies, insurance | Shows whether the core business generates enough cash on its own |
| Investing Activities | Equipment purchases, asset sales, deposits | Captures capital costs that do not appear on the P&L monthly |
| Financing Activities | Loan proceeds, loan repayments, owner draws, equity | Shows how the business is funded and how debt gets serviced |
For a business plan submitted to a lender, the operating section carries the most weight. If your business can pay its expenses and debt from operating cash flow alone, that is the strongest signal a loan officer can see.
How Is a Cash Flow Sheet Different From a P&L?
A cash flow sheet example and a profit and loss projection answer different questions. The P&L tells you whether the business is profitable. The cash flow statement tells you whether the business has enough money in the bank to keep operating.
Here is the honest answer: many profitable businesses run out of cash. A restaurant that books $40,000 in catering revenue in December but collects payment in January could face a payroll gap even while its P&L looks healthy. If you are building a profit and loss projection alongside your cash flow statement, keep the revenue figures consistent but understand they will tell different stories about timing.
Profit (P&L):     Revenue - Expenses = Net Income
Cash Flow:        Beginning Cash + Cash Inflows - Cash Outflows = Ending Cash
Lenders typically require both documents. They will cross-reference the numbers, so if your P&L shows $300,000 in annual revenue while your cash flow statement shows $180,000 in total collections, expect to explain the difference. That gap might be perfectly reasonable (seasonal business, long payment cycles), but it needs to be addressed.
Cash Flow Statement Example: A Coffee Shop's First Six Months
Here is a complete sample of cash flow for a small coffee shop opening with a $150,000 SBA loan and $50,000 in owner equity. The numbers below use assumptions consistent with our coffee shop startup costs guide: $3,500/month rent, 30% cost of goods, and a six-month revenue ramp.
| Line Item | Month 1 | Month 2 | Month 3 | Month 4 | Month 5 | Month 6 |
|---|---|---|---|---|---|---|
| Beginning Cash | $50,000 | $28,200 | $21,550 | $17,500 | $15,050 | $14,900 |
| Sales Revenue | $8,000 | $12,000 | $16,000 | $19,000 | $22,000 | $24,000 |
| Loan Proceeds | $150,000 | $0 | $0 | $0 | $0 | $0 |
| Total Inflows | $158,000 | $12,000 | $16,000 | $19,000 | $22,000 | $24,000 |
| Rent | $3,500 | $3,500 | $3,500 | $3,500 | $3,500 | $3,500 |
| Payroll + Taxes | $6,000 | $7,500 | $8,000 | $8,500 | $8,500 | $8,500 |
| Cost of Goods | $2,400 | $3,600 | $4,800 | $5,700 | $6,600 | $7,200 |
| Utilities + Insurance | $1,500 | $1,500 | $1,500 | $1,500 | $1,500 | $1,500 |
| SBA Loan Payment | $1,400 | $1,400 | $1,400 | $1,400 | $1,400 | $1,400 |
| Equipment + Buildout | $165,000 | $0 | $0 | $0 | $0 | $0 |
| Marketing | $0 | $1,150 | $850 | $850 | $650 | $650 |
| Total Outflows | $179,800 | $18,650 | $20,050 | $21,450 | $22,150 | $22,750 |
| Net Cash Flow | -$21,800 | -$6,650 | -$4,050 | -$2,450 | -$150 | $1,250 |
| Ending Cash | $28,200 | $21,550 | $17,500 | $15,050 | $14,900 | $16,150 |
A few things to notice. The business burns cash for the first five months. That is normal for a coffee shop: you spend the bulk of your buildout capital before the first customer walks in, and revenue ramps gradually. By month six, operating cash flow turns positive at $1,250. The lender is looking for exactly this trajectory: a credible path from negative to positive, with enough cash on hand to survive the gap.
The $165,000 equipment and buildout line in month one represents the one-time capital investment (espresso machines, furniture, counters, plumbing, permits). After that, monthly outflows stabilize around $20,000 to $23,000. If your numbers show a similar spike in month one and steady operations after, that pattern is what a lender expects to see.
How to Build a Sample Cash Flow Projection for Your Plan
Step 1: Pin Down Your Revenue Assumptions
Start with conservative monthly revenue estimates. For a brick-and-mortar business, base these on daily customer count multiplied by average transaction value. A coffee shop serving 80 customers per day at a $6 average ticket projects to roughly $14,400 per month. Build in a ramp: most physical businesses reach steady-state traffic in three to six months, not on day one.
Step 2: List Every Recurring Monthly Expense
Document every cash outflow, not just the big ones. Rent, payroll, COGS, utilities, insurance, marketing, supplies, maintenance, payment processing fees, loan payments. Missing a $400/month expense does not seem like much, but over 12 months it creates a $4,800 gap between your projection and reality. Our cash flow projection template includes a line-item checklist organized by business type.
Step 3: Map the Timing
Cash flow is about timing, not totals. If you pay rent on the first, buy inventory weekly, and run payroll biweekly, map each payment to the month it actually leaves your account. SBA loan payments typically start 60 to 90 days after disbursement, so your first few months may show the loan proceeds without the repayment line.
Step 4: Stress-Test With Scenarios
Run at least two versions: a base case using your best estimates and a conservative case with 20% lower revenue and 10% higher expenses. If the conservative case shows negative cash by month nine, you either need more starting capital or a faster path to revenue. Understanding your burn rate helps you calculate how many months of runway you have under each scenario.
Calculate Your Net Cash Flow
Net Cash Flow Calculator
Estimate your monthly ending cash position
Want to model this over 36 months with scenarios? Try Revenue Map free →
What Lenders Check in Your Cash Flow Forecast
A cash flow forecast example can look clean on paper and still get flagged during the lender's review. Here is what actually gets scrutinized.
Revenue realism. Lenders compare your projections to industry benchmarks. A coffee shop projecting $60,000/month in revenue from day one is going to get pushed back. Show a ramp and cite comparable businesses or your own pre-opening research.
Debt service coverage. The loan officer will check whether your projected operating cash flow covers the monthly loan payment by at least 1.25x. If your net operating cash after expenses is $2,000 and your loan payment is $1,400, your coverage ratio is 1.43x. That passes. Revenue Map's break-even calculator can help you find the revenue level where your business covers all obligations including debt service.
DSCR = Net Operating Cash Flow / Total Debt Payments
Target: 1.25x or higher
Cash reserves. No lender wants to see your ending cash balance drop to zero in month four. A healthy projection keeps at least two to three months of operating expenses as a buffer. In our coffee shop example above, the lowest cash point is $14,900 in month five, which covers about three weeks of expenses. That is tight but defensible if revenue trends are clearly upward.
Consistency across documents. Your cash flow projections should align with your P&L, your use-of-funds breakdown, and your business plan financial projections. Contradictions between these sections raise red flags faster than weak numbers do.
Key Takeaways
- A cash flow statement tracks actual cash movement, not accrual-basis profit. Most small business lenders treat it as the single most important financial document in your plan.
- Show the full first year month by month, with a realistic revenue ramp and one-time startup costs separated from recurring operations.
- Run a conservative scenario alongside your base case so you know how much cash cushion you actually need.
- Keep your cash flow statement consistent with your P&L and use-of-funds breakdown, since lenders cross-reference every section.
- If your numbers show a clear path from negative to positive operating cash flow with adequate reserves, your application is in strong shape.
Building a cash flow projection from scratch takes time, but starting with industry-specific assumptions makes it faster. Run the numbers for your own business, free, in about two minutes.
Related Articles
Business Plan Financial Projections: What Lenders Expect
What financial projections belong in a business plan, how to build them, and the numbers bank and SBA lenders check before approving a loan.
Profit and Loss Spreadsheet Example (Free Template)
Build a profit and loss projection for your business plan. Free template, real examples by trade, and the line items lenders check.
SBA Loan Business Plan: What Lenders Require
Learn exactly what SBA lenders need in your business plan. Covers 7(a) vs 504 requirements, projection formats, DSCR thresholds, and common rejection reasons.