Business Plan Financial Projections: What Lenders Expect
Business plan financial projections include a 12-month profit and loss forecast, a cash flow projection, and a break-even analysis. Most bank and SBA lenders require all three to verify a business can generate enough income to cover its debt payments.
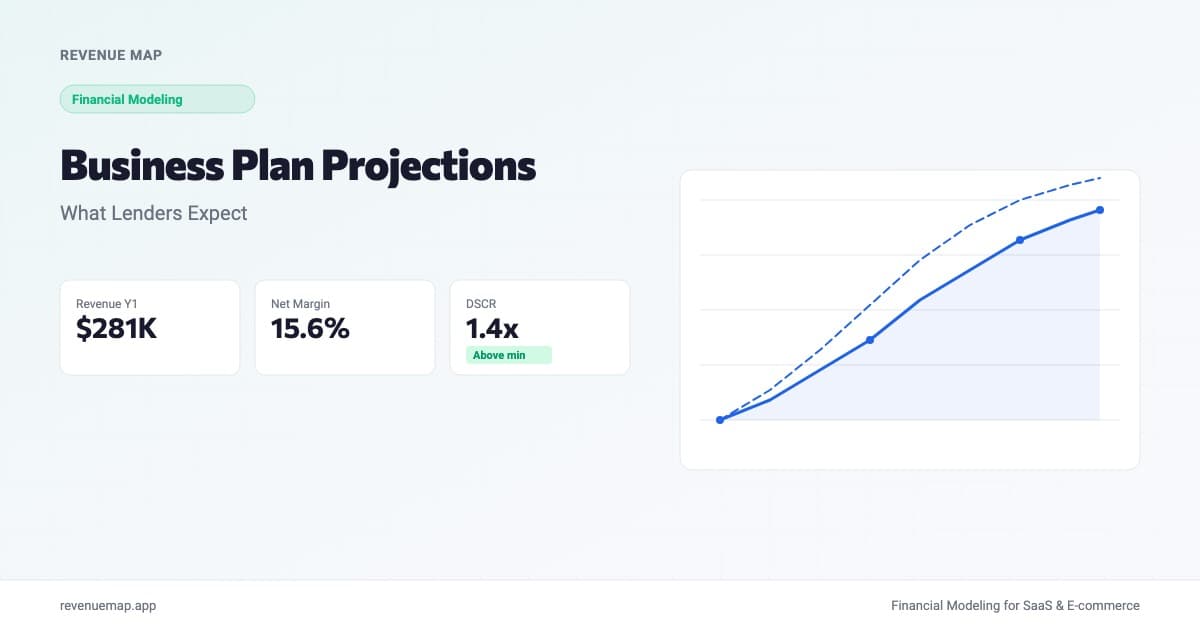
Business plan financial projections are the forward-looking financial statements that show a lender how your business will earn, spend, and manage cash over the next one to three years. If you are applying for a bank loan or SBA financing, the financial projections section is the first thing most underwriters read. A complete set includes a profit and loss forecast, a cash flow projection, and a break-even analysis, each built from realistic assumptions about your specific trade. Think of them as the business plan financial projections template that proves your concept works on paper before you sign a lease or order equipment.
Most applications fail not because the numbers look bad, but because the numbers look incomplete. A recent Small Business Trends report on common overhead expenses highlights how often business owners undercount fixed costs like insurance, maintenance, and administrative fees. Those missing categories show up immediately in your projections as artificially high margins, and a lender who reviews dozens of plans every week will spot the gap before you do. Below is a complete walkthrough of what belongs in the financial section of your business plan, with a worked example of business plan financial projections for a coffee shop.
What Financial Projections Does a Business Plan Need?
The financial section of a business plan typically includes four components. Each serves a different purpose, and lenders expect them to connect logically.
| Document | What It Shows | Why Lenders Care |
|---|---|---|
| Profit and Loss (P&L) Projection | Revenue minus costs equals net income, month by month | Confirms the business is profitable on paper |
| Cash Flow Projection | When cash actually enters and leaves the bank account | Reveals whether you can make loan payments on time |
| Break-Even Analysis | The sales volume needed to cover all fixed and variable costs | Shows when the business stops burning through startup capital |
| Balance Sheet Summary | Assets, liabilities, and owner equity at a point in time | Verifies the business is not overleveraged |
Not every lender requires a balance sheet for a small business application, but all of them expect the first three. If you have already built a P&L projection, the cash flow projection is the natural next step. If you have built neither, start with the P&L: it feeds into everything else.
The key principle behind a useful business plan financial forecast template is that all three documents share the same assumptions. Your revenue number in the P&L should match the cash inflow in your cash flow projection. If the two disagree, the lender will question every other number in the plan.
How to Build Business Plan Financial Projections Step by Step
Start with Revenue Assumptions
Every projection begins with a revenue model. For a physical business, this is straightforward:
Monthly Revenue = Average Transaction x Daily Customers x Operating Days
A coffee shop expecting 130 customers per day at a $7.50 average ticket over 26 operating days projects $25,350 in monthly revenue. Do not pick a round revenue target and work backward. Lenders want to see unit-level math because it is auditable. If you claim $30,000 per month, they will ask how many customers that requires and whether your location can support that traffic.
Build the P&L Projection
The profit and loss projection takes your revenue and subtracts costs in layers: cost of goods sold first (producing your gross margin), then operating expenses, leaving net income at the bottom.
For a detailed walkthrough of every line item by industry, see the P&L projection guide. The short version: use industry benchmarks as starting points (25% to 30% food cost for coffee, 30% to 35% for restaurants, 8% to 15% product cost for salons), then adjust for your specific suppliers and pricing.
Create a Cash Flow Projection
The cash flow projection translates your P&L into actual bank-account timing. Revenue recognition and cash collection are not the same thing. If you buy inventory on the 1st and sell it throughout the month, your cash goes out before it comes back in. Add your startup costs and any loan disbursements to month one, include the monthly loan payment as an outflow, and track the running cash balance.
Here is the thing about cash flow: this is where most business plans reveal their weakest assumption. The ramp period. Month one revenue will not equal month six revenue. A new coffee shop might do 50% of steady-state volume during its first month as word of mouth builds. Model the ramp explicitly or your early cash balances will be dangerously optimistic. For the full template structure, see the cash flow projection guide.
Run a Break-Even Analysis
Break-even tells you how many units or dollars in sales you need to cover all costs before the business starts generating a profit.
Break-Even Revenue = Fixed Costs / (1 - Variable Cost Ratio)
If your coffee shop has $12,000 in monthly fixed costs (rent, insurance, base payroll, loan payment) and variable costs of 38% of revenue (COGS plus hourly labor), the break-even point is $12,000 / (1 - 0.38) = $19,355 per month. Anything above that line is profit. A lender who sees you breaking even by month four or five is more comfortable than one who sees break-even twelve months out. For a deeper dive, see the break-even analysis guide.
Example of Business Plan Financial Projections
Here is a condensed example of business plan financial projections for a small coffee shop with $85,000 in startup costs financed by a $65,000 SBA loan and $20,000 in owner equity. Monthly loan payment is $1,200 (7-year term at 10.5%). You can explore the full coffee shop financial model to adjust these assumptions for your own location.
| Line Item | Month 1 | Month 3 | Month 6 | Month 12 |
|---|---|---|---|---|
| Revenue | $12,675 | $19,013 | $25,350 | $25,350 |
| COGS (28%) | $3,549 | $5,324 | $7,098 | $7,098 |
| Gross Profit | $9,126 | $13,689 | $18,252 | $18,252 |
| Rent | $3,000 | $3,000 | $3,000 | $3,000 |
| Payroll + Benefits | $5,500 | $6,500 | $7,000 | $7,000 |
| Utilities | $800 | $850 | $900 | $900 |
| Insurance | $400 | $400 | $400 | $400 |
| Marketing | $1,200 | $700 | $500 | $500 |
| Other Operating | $800 | $800 | $800 | $800 |
| Total Operating Expenses | $11,700 | $12,250 | $12,600 | $12,600 |
| Net Income | ($2,574) | $1,439 | $5,652 | $5,652 |
| Loan Payment | $1,200 | $1,200 | $1,200 | $1,200 |
| Cash After Debt Service | ($3,774) | $239 | $4,452 | $4,452 |
A few things worth noting. Month one shows a loss because the ramp cuts revenue in half while most fixed costs are already at full run rate. Marketing starts high for the launch, then drops as the customer base stabilizes. By month three, the shop is marginally profitable. By month six, it is generating enough cash to cover the loan payment with room to spare.
The number the lender cares about most in this table is the debt service coverage ratio at steady state. With $5,652 in net income and a $1,200 monthly payment, the DSCR is 4.7x, well above the 1.25x minimum most banks require. That ratio is what turns a "maybe" into an approval. If your own business plan for a bank loan cannot show a DSCR above 1.25x, the rest of the plan rarely matters.
Meanwhile, POS platforms like Toast are rolling out AI-powered tools that generate labor schedules and pricing recommendations automatically. As these tools become standard, the accuracy of projections should improve over time. For now, build conservative assumptions and adjust quarterly once you have real data.
Calculate Your Debt Service Coverage Ratio
DSCR Calculator
Check whether your projected income covers your loan payments
Want to model this over 36 months with scenarios? Try Revenue Map free →
A DSCR of 1.25x is the minimum threshold for most bank and SBA loans. A ratio below 1.0 means the business cannot cover its debt payments from operating income alone. Most lenders prefer to see 1.5x or higher in the projections to account for months that underperform.
Common Mistakes in Business Plan Financial Projections
-
Flat revenue from month one. New businesses ramp. A projection that shows the same revenue in month one as month twelve tells the lender you have not thought through the launch period. Model a ramp of 40% to 60% of steady-state revenue in month one, climbing to full volume by month four to six.
-
Missing expense categories. Equipment maintenance, credit card processing fees, POS subscriptions, accounting, and permits are real costs that add up. The Small Business Trends report on overhead expenses lists the categories most commonly overlooked. Go through them line by line before you call your projections complete.
-
No connection between statements. If your P&L shows $5,000 in monthly net income but your cash flow projection shows $8,000 in monthly cash surplus, the numbers do not reconcile. Lenders will assume the projections were assembled separately and that neither is reliable.
-
Ignoring seasonality. Many physical businesses have seasonal swings. A coffee shop near a college campus may lose 30% of its volume over summer. An ice cream shop peaks in June and dips in January. Build seasonality into the monthly projections rather than using flat averages.
Key Takeaways
- Business plan financial projections include a P&L forecast, cash flow projection, break-even analysis, and optionally a balance sheet. All four should share the same underlying assumptions.
- Build revenue from unit economics (daily customers times average ticket), not from a target number.
- Use industry benchmarks for COGS and operating expenses, then adjust for your specific quotes and lease terms.
- Model the ramp period explicitly. Month one revenue is almost never equal to month six.
- The lender's most important number is your debt service coverage ratio. Aim for 1.25x or higher at steady state.
- Build your own financial projections with Revenue Map: enter your trade, adjust the assumptions, and generate lender-ready projections in about two minutes, free.
Related Articles
Cash Flow Statement Example for Your Business Plan
See a complete cash flow statement example with real numbers. Learn the format lenders expect and how to build one for your business plan.
Profit and Loss Spreadsheet Example (Free Template)
Build a profit and loss projection for your business plan. Free template, real examples by trade, and the line items lenders check.
SBA Loan Business Plan: What Lenders Require
Learn exactly what SBA lenders need in your business plan. Covers 7(a) vs 504 requirements, projection formats, DSCR thresholds, and common rejection reasons.