Profit and Loss Spreadsheet Example (Free Template)
A profit and loss projection shows expected revenue minus costs over a set period. Most lenders require a 12-month P&L projection in a business plan, broken into revenue, cost of goods sold, gross profit, operating expenses, and net income.
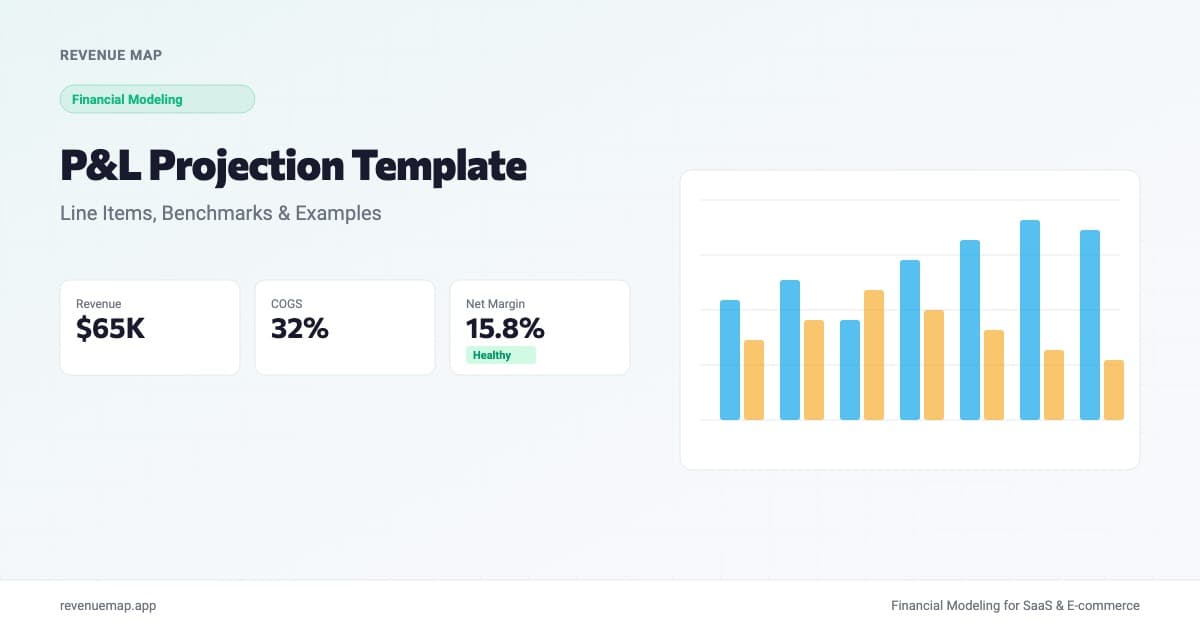
A profit and loss spreadsheet example shows projected revenue, cost of goods sold, operating expenses, and net income for a business over a set period. If you are building a business plan for a bank loan or SBA application, lenders expect a 12-month P&L projection as part of the financial section. The format is straightforward: revenue at the top, costs in the middle, profit at the bottom.
Getting the cost categories right is the part most new owners fumble. According to a recent Small Business Trends report on what counts as overhead, many operators underestimate fixed costs like insurance, rent, and administrative expenses, which throws off the entire projection. Below is a complete walkthrough of how to build P&L projections for your business plan, with line-by-line examples by industry and a free calculator.
What Is a Profit and Loss Projection?
A profit and loss projection (also called a P&L forecast or income statement forecast) is a forward-looking financial statement that estimates how much money a business will earn, spend, and keep over a specific period. Most business plans include monthly P&L projections for year one and annual projections for years two and three.
The structure mirrors a historical income statement: revenue minus cost of goods sold equals gross profit, then gross profit minus operating expenses equals net income. The difference is that a projection uses assumptions and benchmarks rather than actual numbers.
Lenders and investors use the P&L to answer one question: can this business generate enough profit to cover its debts? A well-built profit and loss example template also helps the owner plan staffing, pricing, and inventory before the business opens. If you have built a financial projections template before, the P&L is the core sheet everything else feeds from.
What Line Items Belong in a P&L Projection?
Every income statement forecast template follows the same skeleton, but the specific line items vary by industry. Here is a breakdown of the standard categories:
| Section | Line Items | What It Covers |
|---|---|---|
| Revenue | Product sales, service revenue, delivery fees | All incoming cash from operations |
| Cost of Goods Sold | Raw materials, direct labor, packaging | Costs tied directly to producing the product |
| Gross Profit | Revenue minus COGS | Margin the business earns before overhead |
| Operating Expenses | Rent, utilities, insurance, payroll, marketing | Fixed and variable costs of running the business |
| Net Income | Gross profit minus operating expenses | The bottom line: what the business keeps |
The operating expenses section is where most projections go wrong. Overhead costs like insurance, accounting, maintenance, and debt service are easy to undercount because they do not feel as immediate as rent or payroll. If you have not mapped out every fixed monthly cost, your net income line will look artificially high. A lender who has reviewed hundreds of business plans will spot the gap immediately.
How to Build a Profit and Loss Projection Step by Step
Step 1: Project Monthly Revenue
Start with a realistic revenue assumption. For a restaurant, that might be average ticket multiplied by daily covers multiplied by operating days per month. For a salon, it is average service price times appointments per day. The key is building revenue from units, not picking a round number.
Monthly Revenue = Average Transaction x Daily Customers x Operating Days
If you are opening a coffee shop and expect 120 customers per day at a $7.50 average ticket over 26 operating days, your monthly revenue projection is $23,400.
Step 2: Estimate Cost of Goods Sold
COGS should reflect industry benchmarks. Restaurants typically run 28% to 35% food cost. Coffee shops run 25% to 30%. Salons run 8% to 15% on product cost. Use the benchmark as a starting point and adjust for your specific supplier pricing.
Step 3: List Every Operating Expense
This is where the profit and loss projection template earns its value. Walk through every category: rent, payroll (including taxes and benefits), utilities, insurance, marketing, software and POS fees, maintenance, professional services, loan payments, and miscellaneous. If you are not sure about a number, get a quote. Guessing is what produces projections that fall apart in month three.
Step 4: Calculate Gross Profit and Net Income
Gross Profit = Revenue - COGS
Net Income = Gross Profit - Total Operating Expenses
Gross Margin = (Gross Profit / Revenue) x 100
Net Margin = (Net Income / Revenue) x 100
Your gross margin tells you how much room you have after direct costs. Your net margin tells you whether the business actually makes money after overhead. Both numbers matter to lenders.
Calculate Your Gross Profit Margin
Gross Profit Margin Calculator
Calculate your projected gross margin from revenue and cost of goods sold
Profit and Loss Spreadsheet Example by Industry
The benchmarks below show typical monthly P&L lines for three common small business types. These are illustrative starting points based on industry averages; your actual numbers will depend on location, concept, and scale.
| Line Item | Restaurant | Coffee Shop | Salon |
|---|---|---|---|
| Monthly Revenue | $65,000 | $23,400 | $28,000 |
| COGS (%) | 32% ($20,800) | 28% ($6,552) | 12% ($3,360) |
| Gross Profit | $44,200 | $16,848 | $24,640 |
| Rent | $6,500 | $3,000 | $3,500 |
| Payroll + Benefits | $19,500 | $7,000 | $11,200 |
| Utilities | $2,600 | $900 | $800 |
| Insurance | $800 | $400 | $500 |
| Marketing | $1,950 | $700 | $1,400 |
| Other Operating | $2,600 | $1,200 | $1,200 |
| Total Operating Expenses | $33,950 | $13,200 | $18,600 |
| Net Income | $10,250 | $3,648 | $6,040 |
| Net Margin | 15.8% | 15.6% | 21.6% |
A few things stand out. Restaurants carry heavy payroll and COGS but generate higher absolute revenue. Coffee shops have lower ticket sizes and depend on volume. Salons have the strongest margins because product costs are low relative to service pricing. If you are projecting a different trade, build from the industry-specific benchmarks in your startup cost breakdown, not a generic profit loss forecast template you found online.
What Do Lenders Check in Your P&L?
Banks and SBA lenders review P&L projections for three things:
-
Debt service coverage ratio (DSCR). Your projected net income plus depreciation and interest should be at least 1.25 times your monthly loan payment. Fall below that and the application stalls. A business plan for a bank loan that cannot demonstrate adequate DSCR will not move forward regardless of how polished the rest of the plan looks.
-
Margin consistency. Wild month-to-month swings in margin suggest the projection is not grounded in real assumptions. Lenders prefer to see a gradual ramp, not a hockey stick in month four with no explanation.
-
Expense completeness. Missing categories (no line for insurance, no marketing budget, no owner draw) signal that the applicant has not thought through the full cost picture. This is where the overhead mistake the Small Business Trends article describes shows up most often.
Pairing your P&L with a break-even analysis gives the lender a clear picture of when the business turns cash-flow positive. A three-statement financial model that connects the P&L to a balance sheet and cash flow statement is the gold standard for SBA 7(a) applications.
Common P&L Projection Mistakes
-
Using annual totals instead of monthly detail. Lenders want to see month-by-month projections for year one. A single annual number hides seasonality, ramp-up periods, and cash flow timing problems.
-
Forgetting the ramp period. Month one revenue is almost never equal to month six revenue. A new restaurant might do 40% of steady-state volume in its first month as it builds a customer base. Model the ramp explicitly or your projection will overstate early cash flow.
-
Copying a template without adjusting for your industry. A profit loss forecast template designed for a SaaS company has entirely different line items than one for a food truck. Your COGS, payroll structure, and overhead ratios need to match your actual trade.
Key Takeaways
- A P&L projection is the backbone of the financial section in any business plan, and the first thing most lenders read.
- Build revenue from units (customers times average ticket), not from a target you hope to hit.
- Map every operating expense individually. Overhead categories like insurance, maintenance, and professional services are the ones most commonly missed.
- Match your cost ratios to industry benchmarks: 28% to 35% food cost for restaurants, 25% to 30% for coffee shops, 8% to 15% product cost for salons.
- Pair your P&L with a break-even analysis and cash flow forecast to give lenders the complete picture.
- Build your own P&L projection with Revenue Map: enter your trade, adjust the assumptions, and get a lender-ready projection in about two minutes, free.
Related Articles
SBA Loan Business Plan: What Lenders Require
Learn exactly what SBA lenders need in your business plan. Covers 7(a) vs 504 requirements, projection formats, DSCR thresholds, and common rejection reasons.
Car Detailing Business Plan: Costs and Projections
Build the financial section of your car detailing business plan with real startup costs, revenue estimates, and break-even numbers lenders check.
Cake Shop Business Plan: Costs and Projections
Build the financial section of your cake shop business plan with real startup costs, custom cake pricing, and the cash flow projections lenders require.