Blog
Insights on financial modeling, SaaS metrics, and e-commerce analytics.
LegalTech Financial Model: Revenue, Retention, and Unit Economics
Build a legaltech financial model with revenue projections, CAC benchmarks, and retention metrics. Includes formulas, a calculator, and real benchmarks.
Usage-Based Pricing Model: How to Forecast Consumption Revenue
Learn how to build a usage-based pricing model for API, AI, and infrastructure startups. Includes formulas, benchmarks, and a revenue calculator.
SaaS Growth Rate Benchmarks: What to Target in 2026
What SaaS growth rate should you target? See 2026 benchmarks by stage, from seed to public, plus formulas and efficiency metrics.
How to Segment Churn Rate and Find Hidden Patterns
Learn how to segment your churn rate by plan, cohort, and customer type to uncover retention patterns that aggregate numbers hide.
Vertical SaaS Financial Model: Blended Revenue Guide
Build a vertical SaaS financial model that accounts for subscription + transaction revenue, industry-specific costs, and the benchmarks investors expect.
Startup Burn Rate: How to Calculate, Benchmark, and Cut It
Learn how to calculate gross and net burn rate, compare to stage-specific benchmarks, and apply proven strategies to extend your startup's runway.
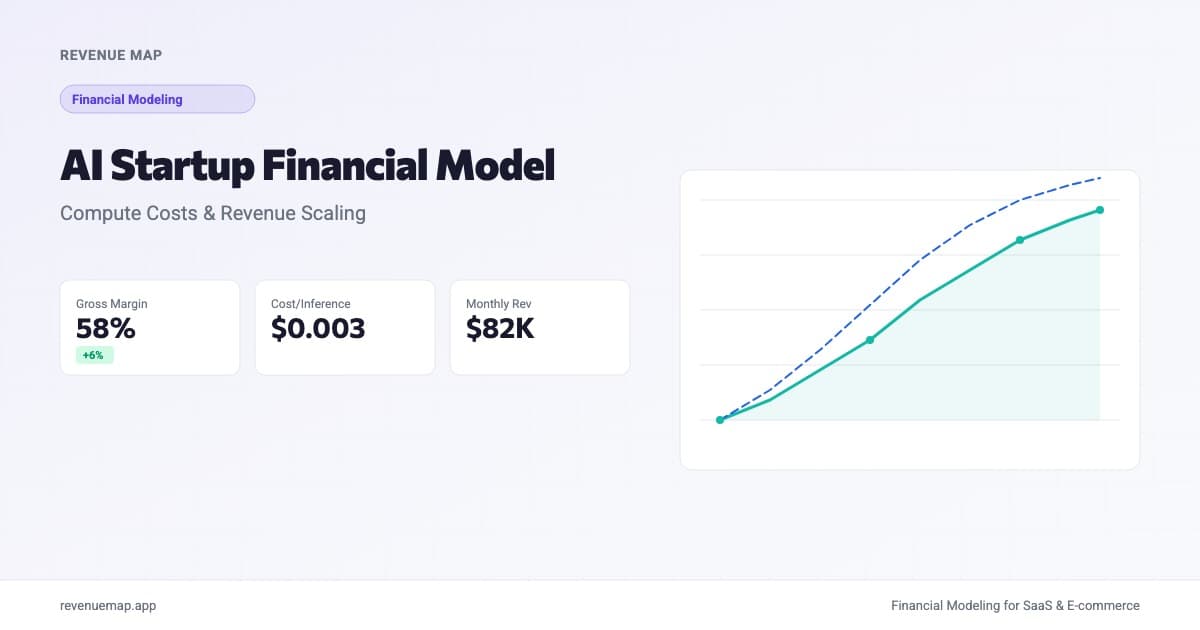
AI Startup Financial Model: GPU Costs and Margins (2026)
AI startup financial model guide covering $18-$25/seat GPU costs, 50-70% gross margins, and inference pricing. Built on 2026 benchmarks investors verify.

Churn Rate Calculation: Formulas, Benchmarks, and How to Reduce It
Learn how to calculate SaaS churn rate with the right formula, compare your numbers to industry benchmarks, and apply proven strategies to reduce customer loss.

Ecommerce Unit Economics: 2026 Benchmarks for AOV, CAC, LTV
Calculate AOV, CAC, and LTV for your online store with step-by-step formulas. Includes 2026 benchmarks by vertical and the 3:1 LTV:CAC profitability rule.
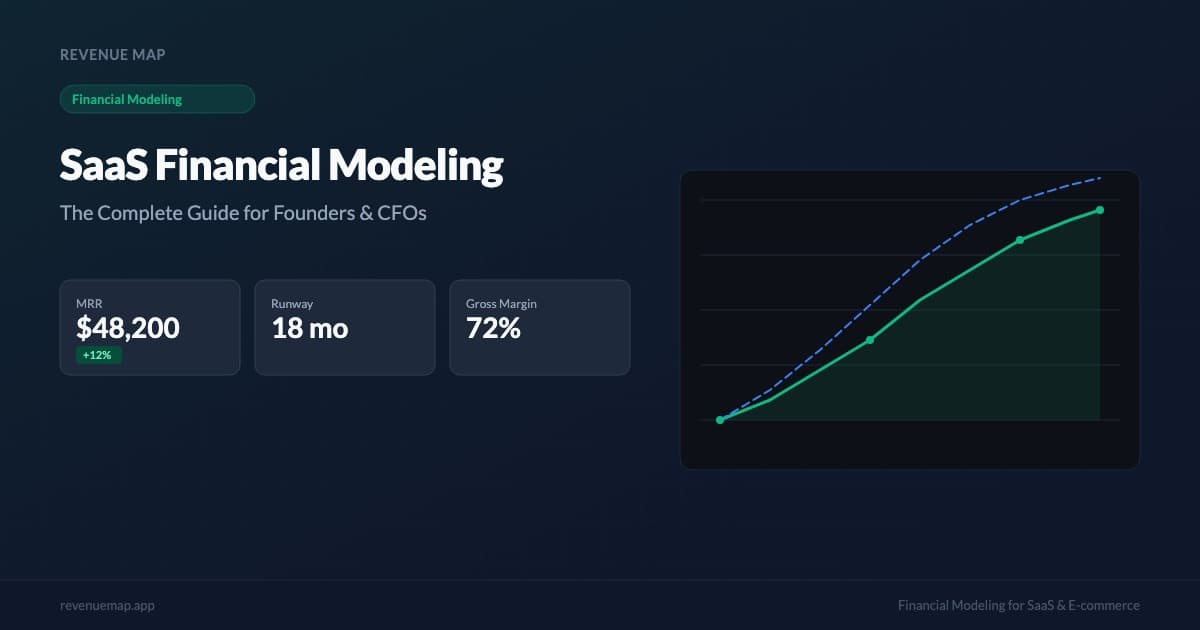
SaaS Financial Modeling: Complete Guide (2026)
Step-by-step SaaS financial model with MRR forecasting, unit economics, scenario planning, and key metrics. Free template included.

Monthly Recurring Revenue (MRR): How to Calculate and Track It
Learn what monthly recurring revenue is, how to calculate MRR correctly, avoid common mistakes, and use it to forecast growth. Includes a free MRR calculator.
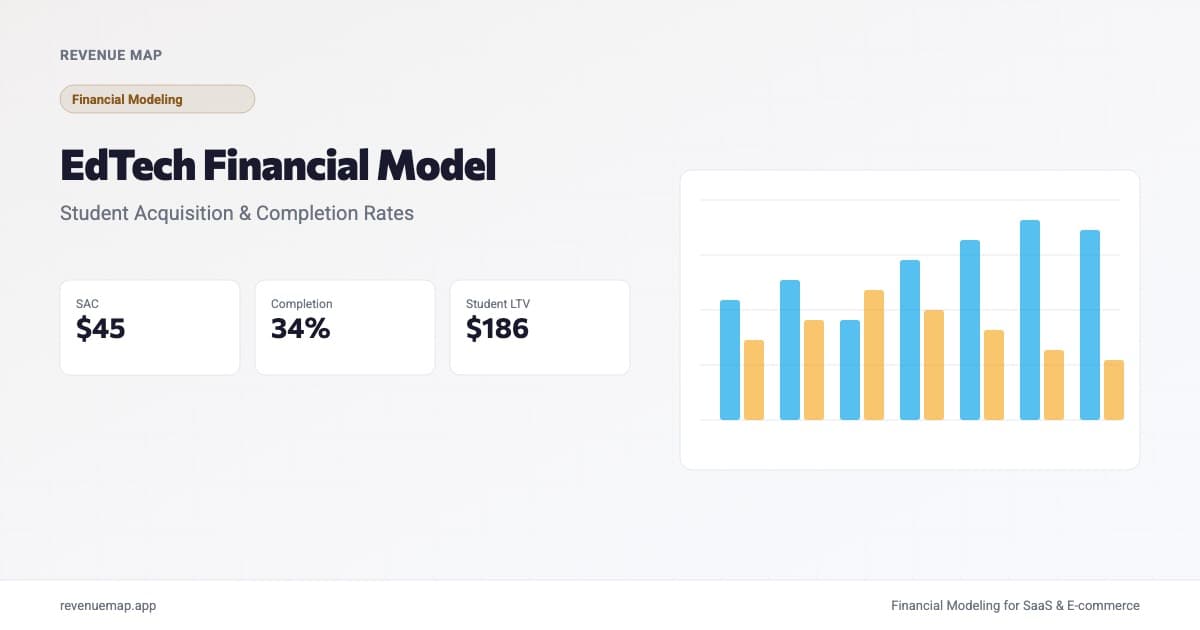
EdTech Financial Model 2026: Free Forecasting Framework
Free EdTech financial model covering student acquisition, completion rates, and unit economics. Works for subscription, per-course, cohort, and B2B pricing.